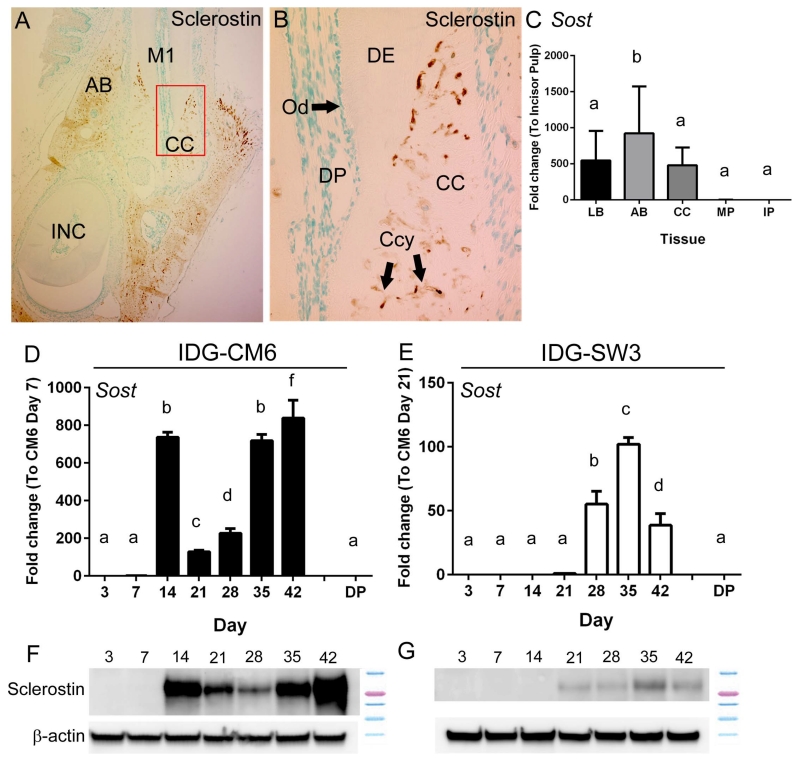
Figure 4. IDG-CM6 cementocytes express sclerostin.
(A) Immunostaining for sclerostin in dentoalveolar tissues around the first molar (M1) of a 3 month old mouse shows localization in cellular cementum (CC) and alveolar bone (AB), but not in dental pulp or odontoblasts. Red box in panel A indicates region of higher magnification in panel B. (B) In cellular cementum, numerous cementocytes (Ccy) positive for sclerostin are observed. (C) Quantitative PCR from tissues confirms expression of Sost mRNA in long bone (LB), alveolar bone (AB), and cellular cementum (CC), but very low expression in molar and incisor pulp (MP and IP, respectively) (n=4 for each tissue, Ct values 23 – 36). IDG-CM6 cementocytes express (D) Sost mRNA and (F) sclerostin protein, in a biphasic profile with peaks at days 14 and 42. (E) IDG-SW3 cells express lower levels of both (E) Sost mRNA and (G) sclerostin protein, and expression is not detected until approximately day 21. Sost mRNA expression from primary dental pulp (DP) is included in panels D and E as a reference for comparison to cells, in vitro. In C-E, data are presented as mean ± SD. In D and E, IDG-CM6 and IDG-SW3 cells are graphed separately due to scale differences. (Ct values for IDG-CM6: 22-33, IDG-SW3: 28-36). One-way ANOVA and Tukey post-hoc test were used to indicate inter- or intragroup statistical significance. Different lowercase letters above bars indicate significant (p < 0.05) intragroup differences over time.

