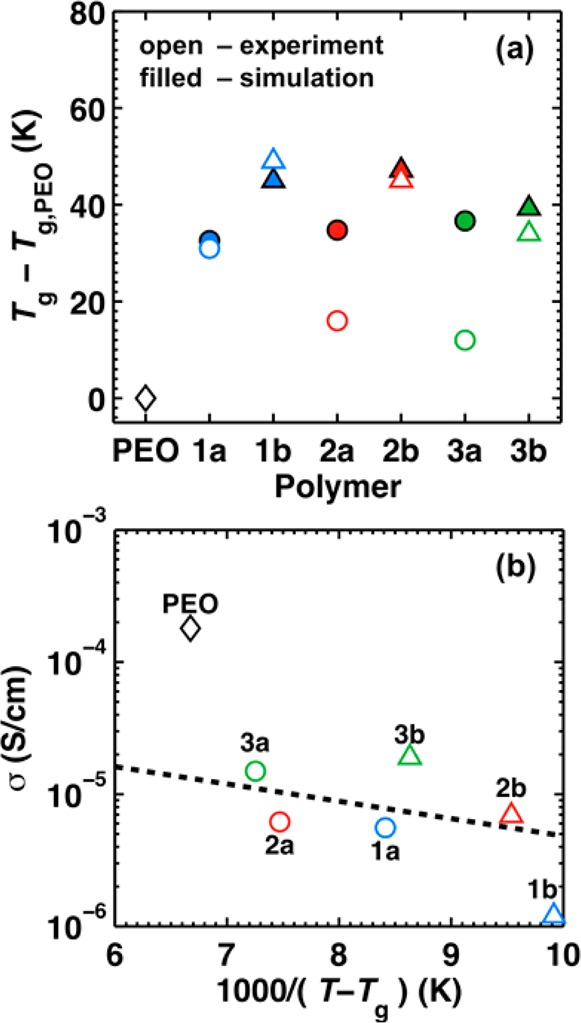
Figure 4.

(a) Tg obtained via experiment using DSC (open symbols) and via MD using simulated dilatometry (filled symbols). (b) Correlation between dilute-ion conductivity and the inverse temperature difference from Tg at T = 363 K (experimental measurements). The dashed line indicates the linear fit of the data for the polyesters.
