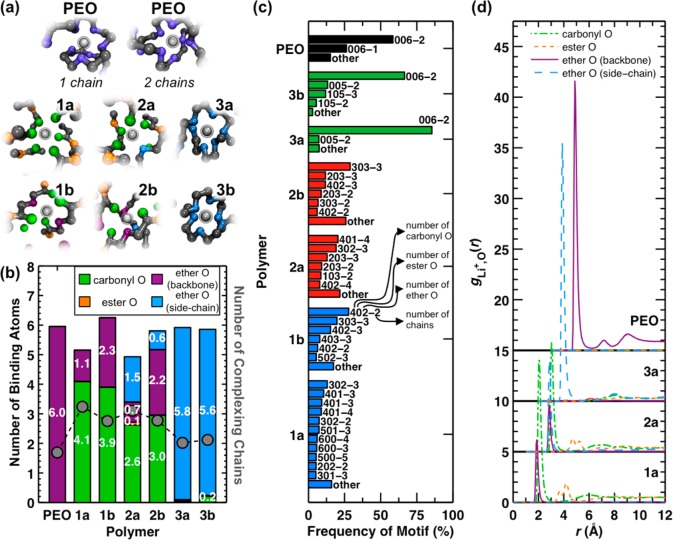
Figure 5.
Analysis of lithium-ion coordination data from MD simulations at 363 K. (a) Representative snapshots of lithium-ion binding motifs observed in the MD simulations. The lithium cation is shown in silver, carbon atoms are black, and the oxygen atoms are colored according to the scheme in Figures 2 and 5b. (b) The average number of oxygen atoms (left y-axis) and polymer chains (right y-axis) in the first solvation shell of the lithium cation. Vertical bars report the number of different oxygen types; markers report the number of coordinating chains in the solvation shell. Note that backbone ether contributions to the type-a polymers arise due to interactions with the terminal groups of the polymer chains. (c) Frequency of occurrence for lithium-ion binding motifs, where the binding motifs are defined according to the number of each oxygen type and the number of coordinating chains. The first three numbers refer to the number of carbonyl, ester, and ether oxygen atoms, respectively; the number following the dash refers to the number of different contiguous polymer chain segments (i.e., 402-2 indicates a motif with four carbonyl oxygens, zero ester oxygens, and two ether oxygens from two different chains). Only binding motifs that constitute more than 5% of the ensemble are explicitly listed; the remainder are included in “other”. (d) Cation-oxygen radial distribution functions gLi+,o(r) for different oxygen types in the type-a polymers and in PEO. The gLi+,o(r) for each oxygen type is normalized with respect to the total oxygen number density in the polymer. Following the data set for polymer 1a, each subsequent data set is shifted vertically (by 5 units) and horizontally (by 1 Å) for clarity. All statistical properties are calculated from snapshots taken at 100 ps intervals during the MD trajectory. A threshold distance of 3.25 Å from the lithium cation is used to identify constituents of the first lithium-ion solvation shell.

