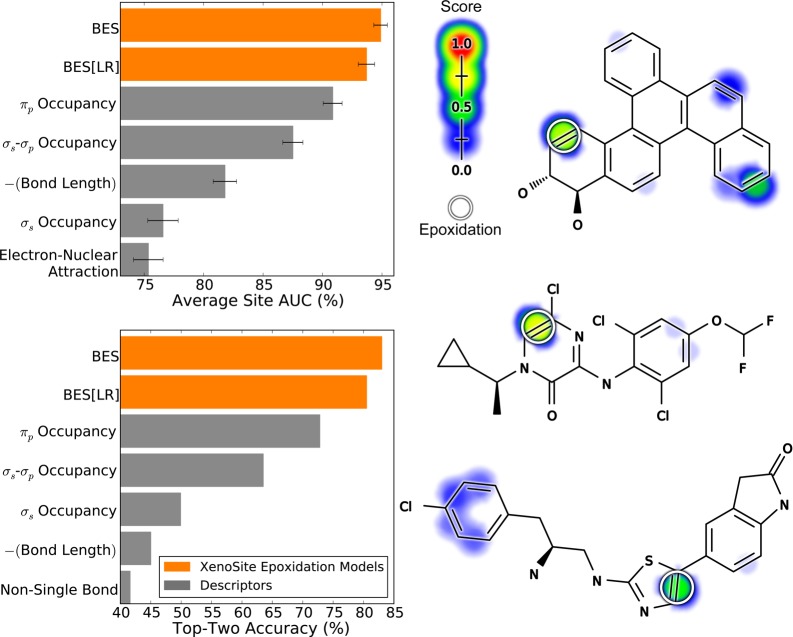
Figure 4.
Bond epoxidation scores accurately (BES) identify sites of epoxidation (SOEs). Top left, for each prediction method, average site AUC was computed for 389 molecules extracted from the Accelrys Metabolite Database with their SOEs labeled. This metric reflected how often SOEs were ranked above other sites within these molecules. Bottom left, top-two classification performance was computed, by which a molecule was considered correctly predicted if any of its observed SOEs were predicted in the first- or second-rank position. By both metrics, the cross-validated predictions generated by a neural network (BES) outperformed the predictions of a logistic regressor (BES[LR]). The classification performance of BES also exceeded that of all raw descriptors, the five best of which are included in each panel. Right, examples from the data set are visualized with their predictions.52−54 In the bar graph axis, the two-center electron–nuclear attraction energy is abbreviated as electron–nuclear attraction. For each molecule, the colored shading represents BES, which range from 0 to 0.73. Each experimentally observed SOE is circled.

