Figure 1.

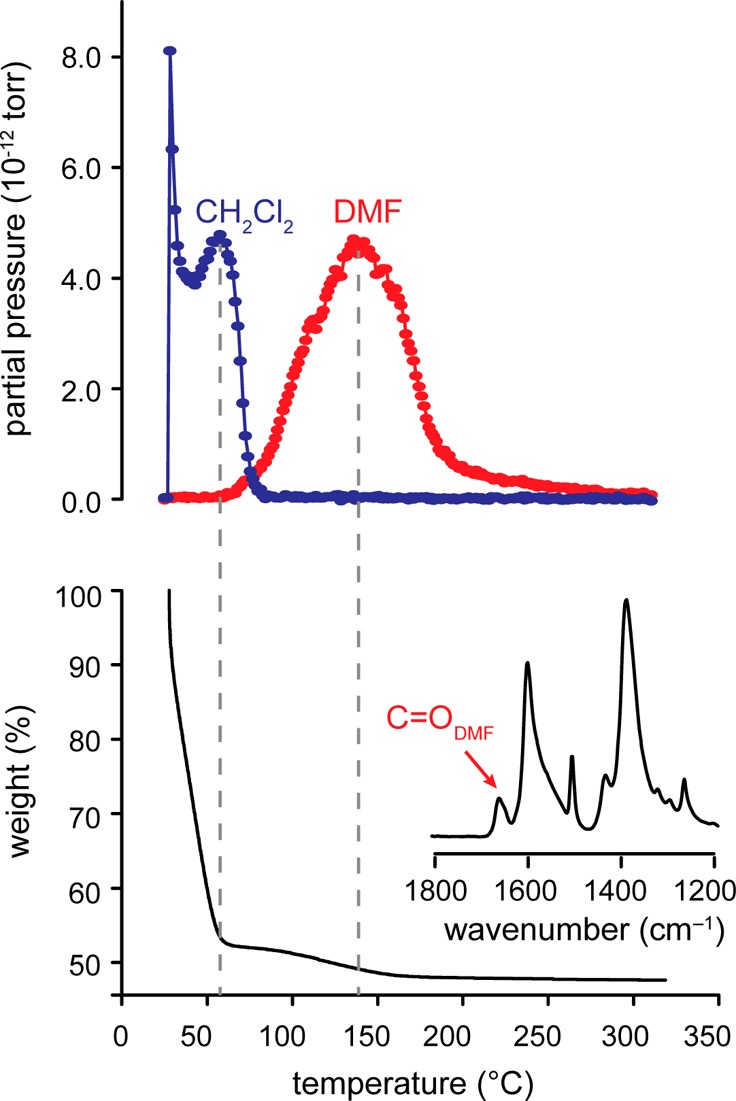
A TGA analysis (bottom) shown alongside mass spectrometry (top) of CH2Cl2- and DMF-soaked MOF-5. A selected portion of the FT-IR spectrum of this sample is shown as an inset.

A TGA analysis (bottom) shown alongside mass spectrometry (top) of CH2Cl2- and DMF-soaked MOF-5. A selected portion of the FT-IR spectrum of this sample is shown as an inset.