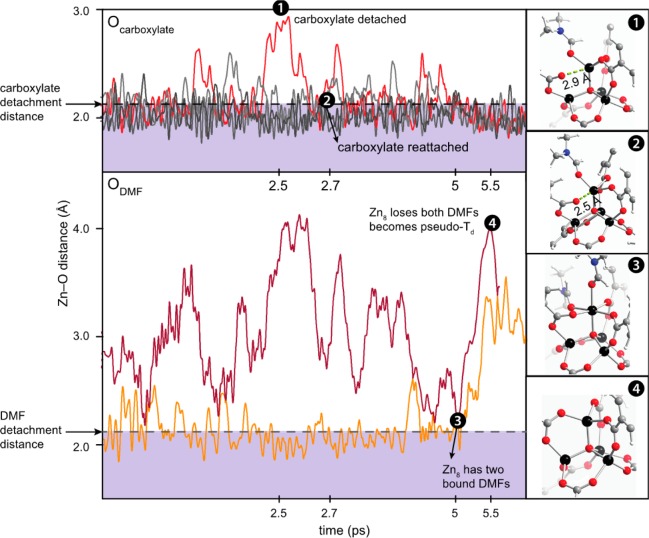
Figure 4.
Summary of the BOMD simulated trajectories corresponding to the pseudo-octahedral Zn site, Zn8, for the first 6 ps. Zn–O distances are plotted at the top for the framework carboxylates and at the bottom for the two nearest DMF molecules. Snapshots of the simulation are shown at time points (ps) on the right. The carboxylate oxygen that dissociates completely is shown as the red trace in the Ocarboxylate panel. The two colored traces in the ODMF panel represent the positions of the oxygen atoms of two DMF molecules in the vicinity of Zn8. The Zn–O bonding regions are defined by the colored rectangular regions starting at 2.2 Å for both carboxylate and DMF oxygen atoms.

