Figure 3.

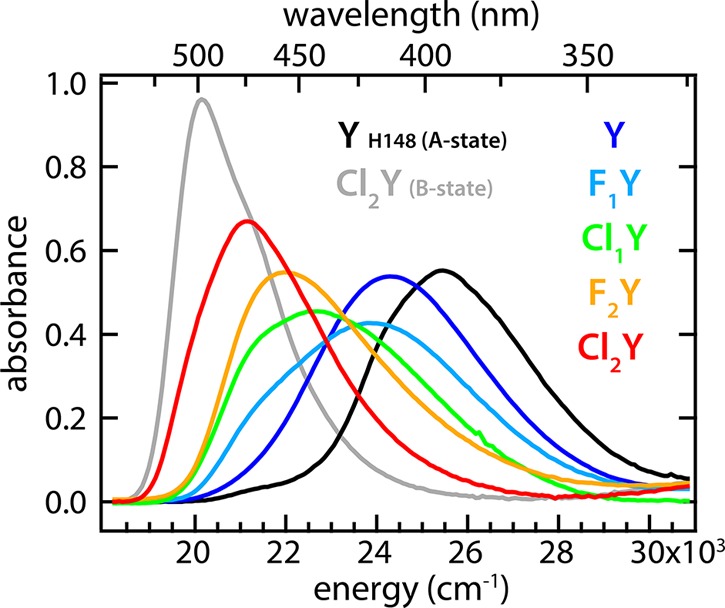
Spectra of natured substituted GFP protein in the limit of low pH (colored traces) shown with spectra for pure A- and B-states for comparison. All spectra are scaled by their associated B-state oscillator strength.

Spectra of natured substituted GFP protein in the limit of low pH (colored traces) shown with spectra for pure A- and B-states for comparison. All spectra are scaled by their associated B-state oscillator strength.