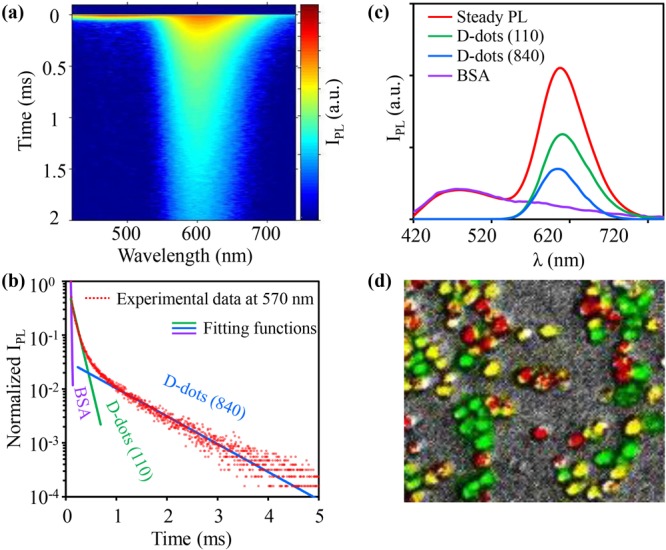
Figure 4.

(a) Time resolved emission spectrum of the solution composed of BSA and two types of d-dots. Colors from red to blue represent the logarithmic PL intensity from high to low. (b) PL decay curve at 570 nm with fitting functions. (c) PL spectra of the solution and three reconstructed components. (d) In vitro image (false color) of a mixture of three groups of cells labeled with d-dots with three different PL lifetimes.
