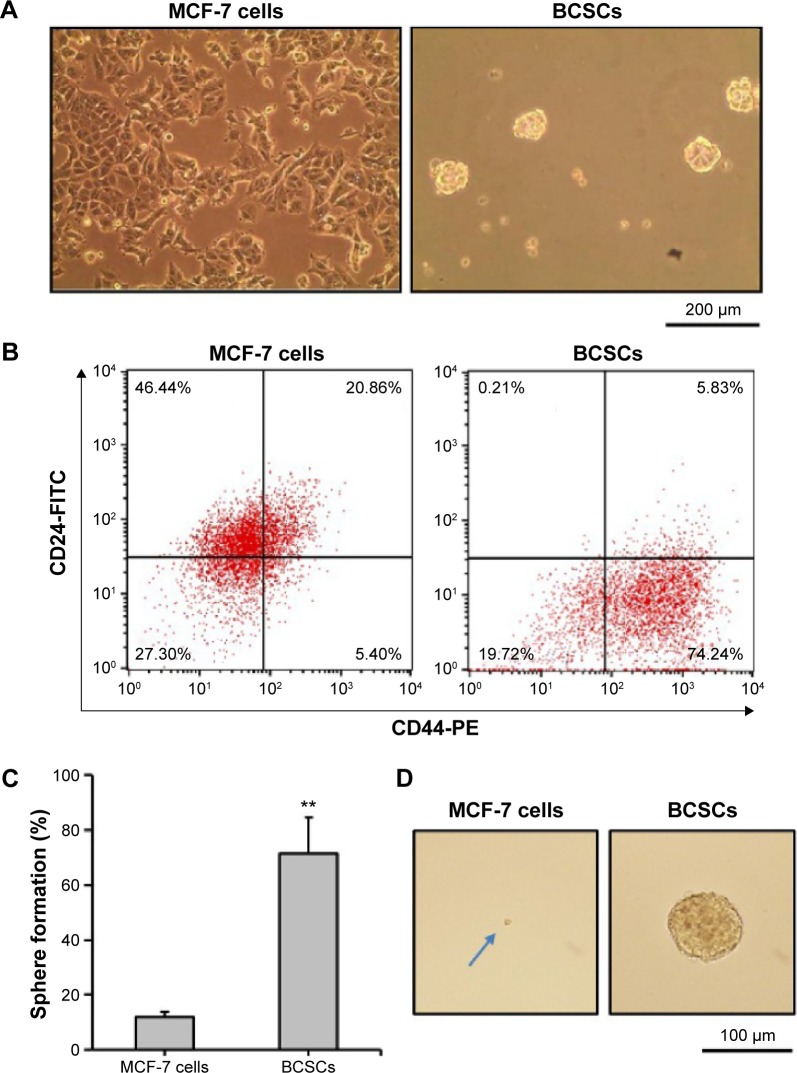
Figure 1.
Isolation and characterization of BCSCs.
Notes: (A) Morphology of MCF-7 cells and BCSCs, observed using a bright-field microscope (scale bar =200 μm). (B) Flow cytometric analysis of the cells for CD24− and CD44+ population. (C) Percentages of secondary sphere formation from the single cells from MCF-7 cells or BCSCs. (D) Representative photographs of secondary spheres (scale bar =100 μm) (the blue arrow indicates a single cell, which didn’t form a sphere). Data shown represent the mean ± SD of three experiments (**P<0.01).
Abbreviations: BCSCs, breast cancer stem cells; SD, standard deviation; FITC, fluorescein isothiocyanate; PE, phycoerythrin.

