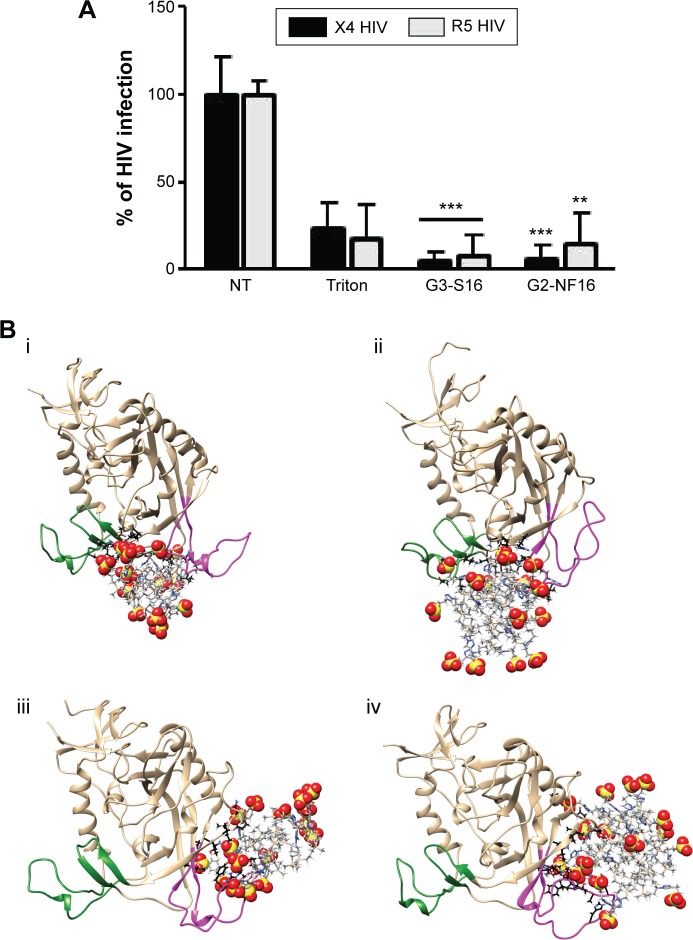
Figure 3.
HIV inactivation by G3-S16 and G2-NF16.
Notes: (A) HIV particles were treated with 5 μM of dendrimers or with Triton X-100 (1%) 1 hour before exposure to activated PBMCs. Antigen p24gag in PBMC supernatants was quantified by ELISA (**P<0.01, ***P<0.001 vs control). Data represent the mean ± SD of three independent experiments. (B) Molecular modeling of gpl20–dendrimer complexes. Top – dendrimers bound to gpl20 in the coreceptor binding site (i – gpl20–G2-NF16, ii – gpl20–G3-S16). Bottom – dendrimers bound to gpl20 near the V3 loop base (iii – gpl20–G2-NF16, iv – gpl20–G3-S16). V3-loop is in magenta; bridging sheet (terminal parts of V1/V2 loops) is in green. Only the closest amino acids to the dendrimer are shown (in ball and stick) using black color for carbons to distinguish them from dendrimer carbons (in gray, stick representation). Colors of the other elements are: O – red, S – yellow, H – white, and Si – tan. For the dendrimer SO3 groups, the sphere representation is used.
Abbreviations: HIV, human immunodeficiency virus; PBMCs, perpipheral blood mononuclear cells; ELISA, enzyme-linked immunosorbent assay; SD, standard deviation; NT, nontreated.

