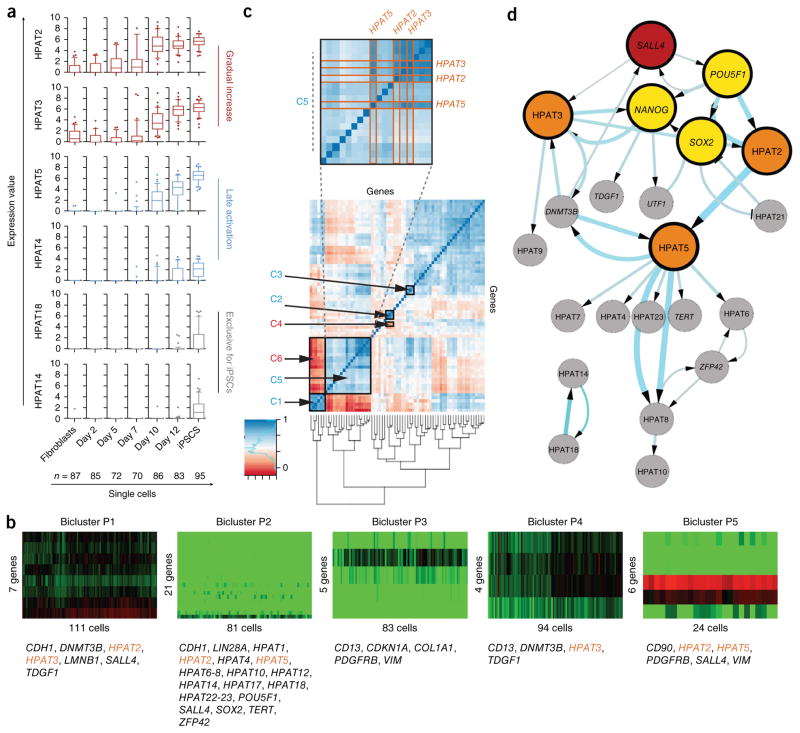
Figure 2.
Single-cell expression analysis of HPAT transcripts during nuclear reprogramming. (a) Dynamics in single-cell expression of HPAT transcripts during nuclear reprogramming shown as box plots. HPATs are grouped according to activation pattern (with two examples representing each group). (b) Bicluster analysis identifies five biclusters, P1–P5, and correlates HPAT2, HPAT3 and HPAT5 (gene names in orange) with core pluripotency markers (method by Lazzeroni and Owen52). (c) Correlation analysis across single cells identifies positively and negatively correlated gene pairs (see supplementary table 3 for additional details). (d) Bayesian network analysis predicts a central role for HPAT2, HPAT3 and HPAT5 (orange circles) within the core regulatory network (yellow circles). The hierarchical view predicts that SALL4 (red circle) triggers a cascade of key pluripotency gene activation. Arrow thickness and circle size increase with the confidence level of interactions in the calculated network. Only pluripotency genes and lincRNAs were included. Data in a–d represent n = 578 single cells.

