Figure 5.
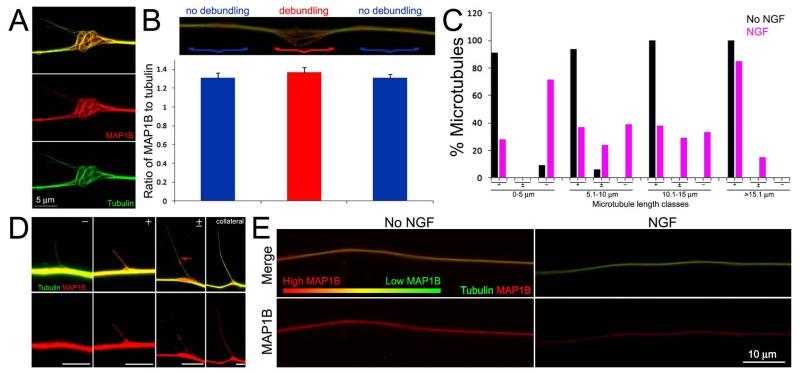
Treatment with NGF alters the levels of microtubule associated MAP1B during early stages of collateral formation. (A) Example of MAP1B distribution at a site of microtubule debundling along an NGF treated axon. Note that MAP1B is found along the length of debundled and splayed microtubules. Image is contrast enhanced to highlight the relationship between individual microtubules and MAP1B. (B) Quantification of the ratio of MAP1B to tubulin staining in simultaneously fixed and extracted axons. The image shows the relative sites of measurement, denoted by }, and the according ratiometric measurements are shown in the graph below. Ratios were determined at the site of debundling (red) and adjacent distal and proximal segments of similar lengths (blue). The ratios were not statistically different (n=20 debundling sites from 20 axons; p=0.22 Kurskal-Wallis non-paramteric ANOVA). (C) Distributions of microtubules with tips extending outward from the axon shaft that exhibited MAP1B staining in no NGF (n=55) and NGF treatment (n=113) groups. +, ± and − denote categories of microtubules stained by MAP1B along their entire length, showing partial coverage and no MAP1B staining, respectively. See (D) for examples of these categories. The percent of microtubules falling into categories is shown as a function of the length of microtubules. (D) Examples of MAP1B staining patterns along microtubules. The categories (+,±,−) are denoted as in panel (C). The red arrow in the ± panel shows the extent of MAP1B staining. Bars = 5 μm. Images are contrast enhanced to best reveal relevant features (i.e., individual microtubules which would be of low intensity relative to the full array in the axon shaft). (E) Examples of the relative staining intensities of MAP1B and tubulin in simultaneously fixed and extracted axons. Raw data images are shown, all samples were stained in parallel and images acquired using identical acquisition protocols. The axon not treated with NGF exhibits more yellow color than the NGF treated axon, reflecting a greater level of MAP1B relative to tubulin than the NGF treated axon which appear greener. Individual MAP1B channels are shown in the bottom panels. The false color gradient bar provides a visual representation of the relative levels of MAP1B (red) to tubulin (green).

