
Figure 9. Gene network analysis.
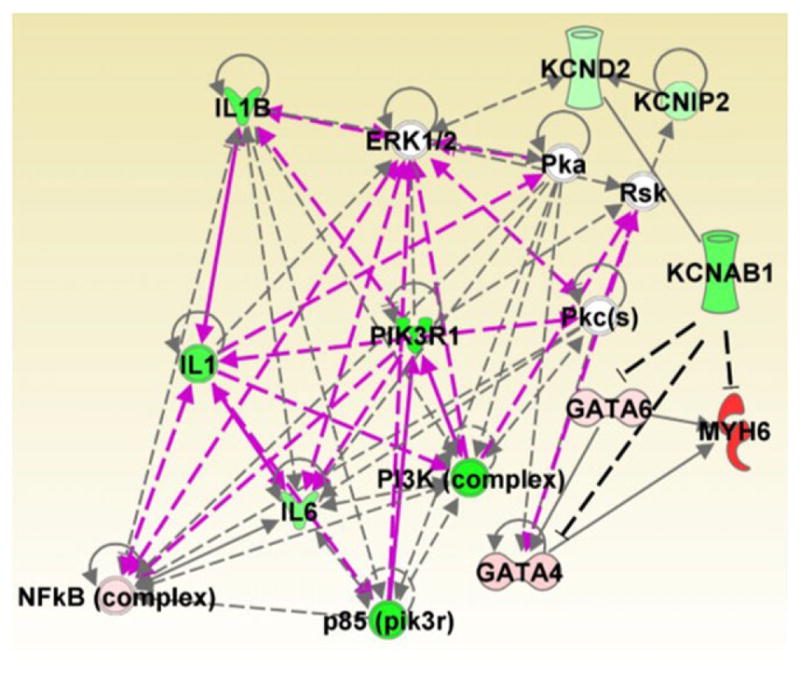
The top two networks identified by Ingenuity Pathway Analysis based on qPCR-expression data were merged. Potential interactions between KCNAB1 and MYH6 (MHCα) or GATA factors were incorporated into the analysis and indicated by dashed black lines. Relative gene expression differences between the WT and KO groups are depicted by a colour gradient from green to red; green represents higher expression for WT, whereas red represents KO. ERK1/2, extracellular signal-regulated protein kinases 1 and 2; IL1, Interleukin-1; IL1B, Interleukin 1-Beta; IL6, Interleukin-6; KCND2, Kv4.2; KCNIP2, Kv Channel Interacting Protein 2; KCNAB1, Kv Beta 1.1; MYH6, Myosin heavy chain alpha; NFkB, Nuclear Factor Kappa-B; PI3K, Phosphoinositide-3-Kinase; PIK3R1, Phosphoinositide-3-Kinase Regulatory Subunit 1; Pka, cAMP-dependent Protein Kinase, Pkc, Protein Kinase C; RsK, Ribosomal Protein S6 Kinase.