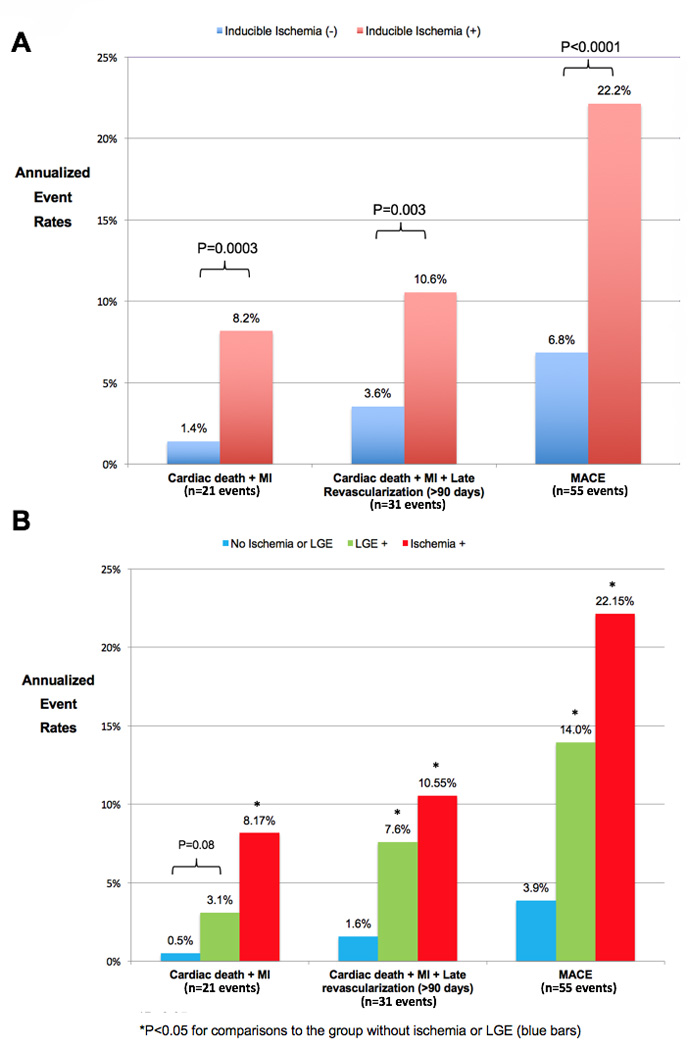
Figure 2. Estimated annualized event rates in diabetics stratified by the presence or absence of inducible ischemia and late gadolinium enhancement by stress perfusion CMR (N=173).

A) Annualized event rates for the primary and secondary outcome measures stratified by the presence (red bars) or absence (blue bars) of inducible ischemia by stress perfusion CMR demonstrate significantly lower annual event rates for both primary and secondary composite outcome measures. B) Annualized event rates for the primary and secondary outcome measures stratified by the presence of LGE (green bars), presence of inducible ischemia (red bars), or absence of both LGE and inducible ischemia (blue bars). *Indicate P values <0.05 for stratified comparisons between event rates. LGE = subendocardial late gadolinium enhancement, MACE = cardiac death, non-fatal MI, late revascularization (>90 days), stroke, and hospitalization for unstable angina, MI = myocardial infarction.
