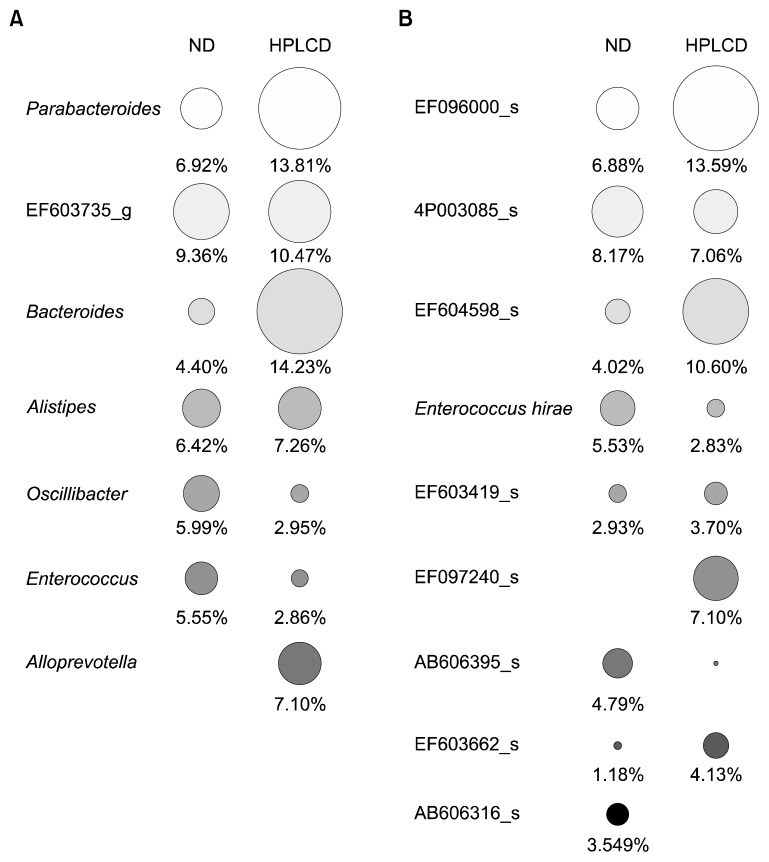
Fig. 3.
Circle type heat map of relative percent abundance of major taxa in gut microbiota of mice. Genus (A) and species (B) levels. Circle size indicates relative composition of each taxon [full size of circles of (A) and (B) indicates 30.27% and 28.39%, respectively]. Minor taxa that individual composition was less than 5% and 3% were excluded in genus and species level, respectively. ND, normal diet; HPLCD, high-protein/low-carbohydrate diet.

