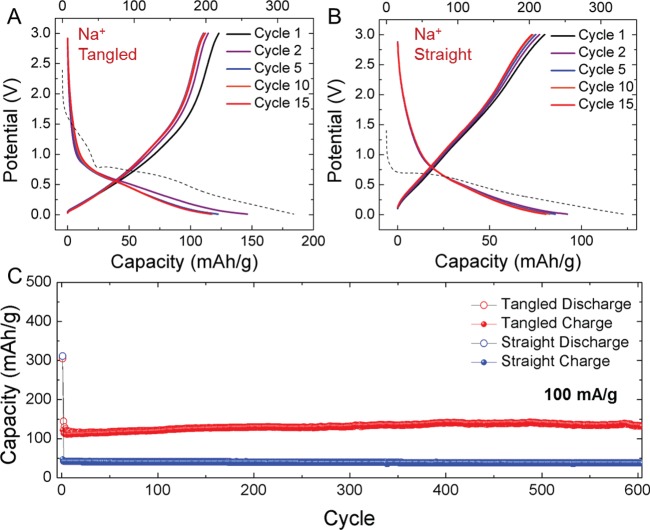
Figure 3.
CO2-derived Na-ion batteries. (A–B) First 15 galvanostatic charge–discharge profiles for CO2-derived straight and tangled CNTs at current density of 100 mA/g. The first discharge (dashed line) is longer than subsequent discharge cycles due to SEI formation and is referenced to the top axis in mAh/g. (C) Extended cycling performed at current density of 100 mAh/g over 600 cycles for both straight and tangled CNTs.

