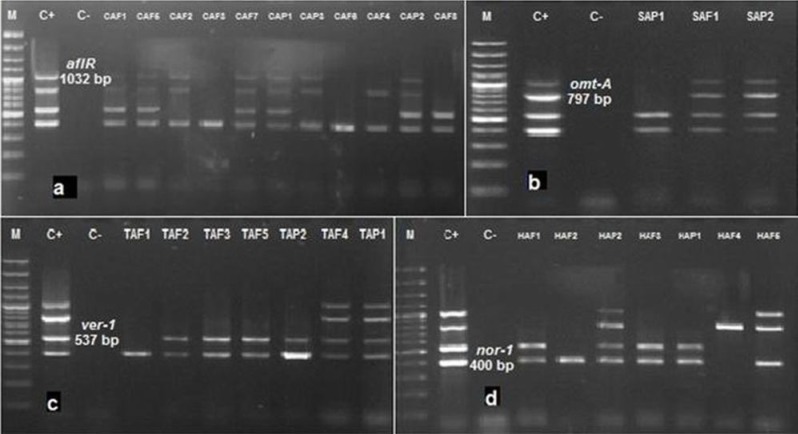
Fig. 1.
Agarose gel electrophoresis of multiplex PCR products amplified from A. flavus and A. parasiticus isolated from feedstuffs. M: 100 bp DNA molecular size marker, C+: Positive control (A. parasiticus ATCC 15517), and C-: Negative control (without genomic DNA). (a): DNA banding patterns of A. flavus and A. parasiticus isolates of concentrate samples, (b): DNA banding patterns of A. flavus and A. parasiticus isolates of silage samples, (c): DNA banding patterns of A. flavus and A. parasiticus isolates of TMR samples, and (d): DNA banding patterns of A. flavus and A. parasiticus isolates of hay samples

