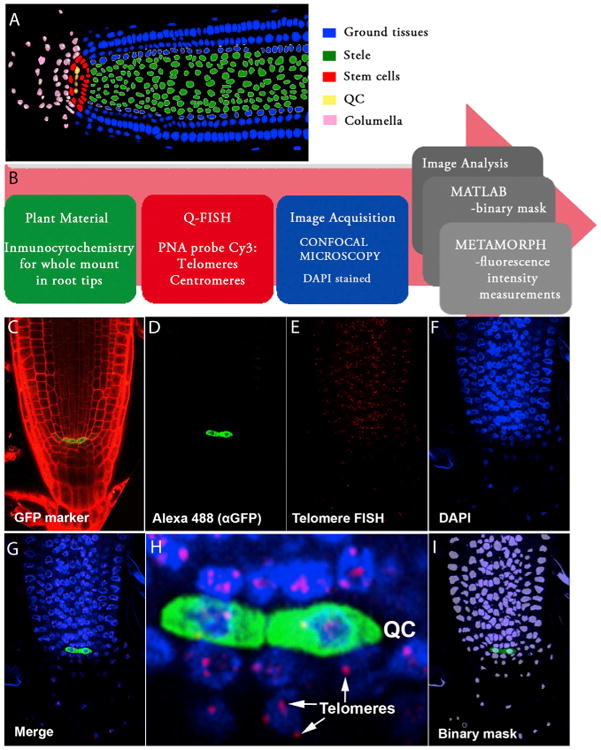
Figure 1. A Q-FISH-Based Telomere Distribution Map in the Arabidopsis Root Apex.

(A) Schematic representation of meristem organization in a 6-day-old Arabidopsis root. The color code identifies the different cell types: ground tissues (epidermis, cortex, endodermis, and lateral root cap) in blue, stele in green, stem cell niche in red, quiescent center (QC) in yellow, and columella cells in pink.
(B) Pipeline describing the experimental setup for whole-mount root telomere Q-FISH. Six-day-old Arabidopsis roots were subjected to a whole immunocytochemistry process using GFP markers (green box). GFP immunofluorescence was combined with confocal Q-FISH directly using a PNA Cy3-labeled telomeric/centromeric probe (red box). DAPI, Cy3, and Alexa 488 signals were acquired simultaneously into separate channels using a confocal microscope. The DAPI image was used to define the nuclear area to create a binary mask that allows isolation of each nucleus (blue box). The segmentation method was implemented using MATLAB (gray box). In the final step of the pipeline, Metamorph software was used to combine the binary DAPI mask and the matching Cy3 image. Cy3 fluorescence intensity (telomere fluorescence) was measured as “average gray values” units (a.u. of fluorescence). A code of four colors was used to classify the nuclei according to their average telomere fluorescence (gray box). A large pink arrow indicates the flow direction of the whole mount root Q-FISH procedure.
(C) Six-day-old roots stained with PI. The GFP marker (green) stains the pWOX5:GFP expression domain, coinciding with the quiescent cells.
(D–G) Confocal images showing the QC labeled by pWOX5:GFP (D), Q-FISH using a telomeric PNA probe stained with Cy3 (E), cell nuclei stained with DAPI (F), and a merged image for all three channels (G).
(H) Inset showing, with cellular resolution, the QC and surrounding cells, together with their corresponding telomeres indicated by arrows.
(I) Binary mask generated in MATLAB and used for individual nuclei fluorescence intensity quantification (see the Supplemental Information).
