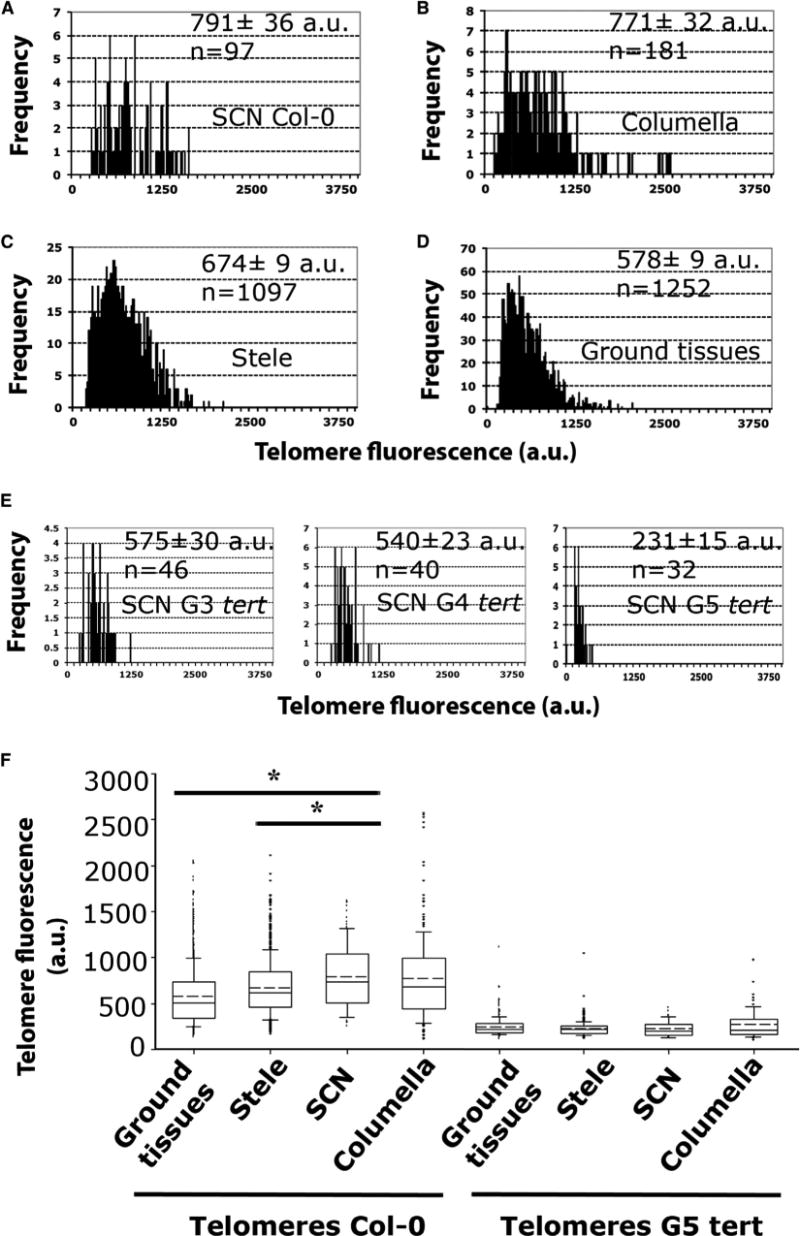
Figure 3. The Longest Root Telomeres Are Mapped in the Stem Cell Niche.

(A–D) Q-FISH histogram showing telomere fluorescence frequencies in the different cell types of Col-0 root: stem cell niche (SCN) (A), columella (B), stele (C), and ground tissues (D). Average telomere fluorescence and SEM are indicated. See also Figure S2.
(E) Q-FISH histograms of G3, G4, G5 tert stem cell niche. Note the high difference in telomere length compared to Col-0 stem cell niche.
(F) Boxplots showing the heterogeneity between cell types in telomere-length distributions of Col-0 compared to G5 tert. Boxes represent the interquartile range (25th–75th percentiles, median indicated by the black horizontal line, average indicated by the dashed line) of the distribution, whiskers extend to the 10th and 90th percentiles and outliers are represented by black dots. n represents the number of nuclei pooled for the histograms from seven individual Col-0 plants and from three plants for each G3, G4, and G5 tert mutants. For Col-0 and G5 tert roots, SCN telomere-length values were compared to ground tissues, stele, and columella values. Statistical significant differences were observed in Col-0 only between SCN and stele and between SCN and ground tissues. In the G5 tert mutants, no differences were observed between cell types. *p < 0.05.
