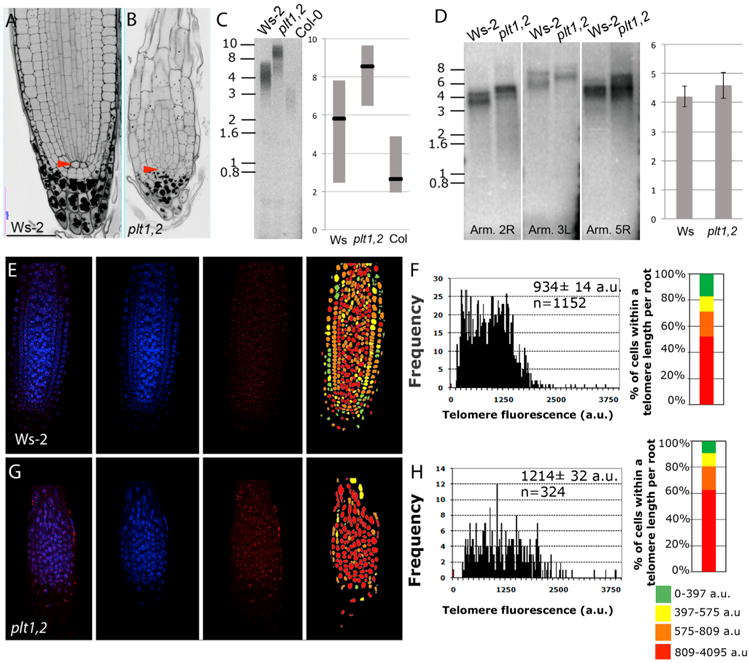
Figure 6. Early Differentiation in the Meristems of plt1 plt2 Mutants Prevents Telomere Erosion in the Primary Root.

(A and B) mPS-PI-stained root tips of 6-day-old WT (Ws-2) (A) and plt1 plt2 (B) roots. Scale bars, 100 μm. See also Figure S6.
(C) TRF analysis in shoot of WT (Ws-2) and plt1 plt2 mutants. The blot was hybridized with a radiolabeled telomeric (T3AG3)4 probe. Molecular weight markers and a schematic representation of the chromosome length are indicated.
(D) PETRA analysis of the 2R, 5R, and 3L telomeres in WT (Ws-2) and plt1 plt2. A telomeric probe was used to detect PETRA products. Molecular weight markers are indicated. Quantification of the average telomere length in kilobases of PETRA bands of different chromosome arms in WT (Ws-2) and plt1 plt2.
(E) Q-FISH in Ws-2 root telomeric PNA probe stained with Cy3, cell nuclei stained with DAPI, and a merged image for both channels. Representative telomere-length pseudo-color images of WT. Nuclei are colored according to their average telomere fluorescence in a.u.
(F) Q-FISH histogram showing telomere fluorescence frequencies in Ws-2. Average telomere fluorescence, SEM and the number of nuclei n, pooled from three individual Ws-2 plants, are indicated.
(G) Q-FISH in plt1 plt2 root telomeric PNA probe stained with Cy3 cell nuclei stained with DAPI and a merged image for all the two channels. Representative telomere-length pseudocolor images of WT. Nuclei are colored according to their average telomere fluorescence in a.u. See also Figure S6.
(H) Q-FISH histogram showing telomere fluorescence frequencies in plt1 plt2. Average telomere fluorescence and SEM are indicated. Average telomere fluorescence, SEM, and the number of nuclei n, pooled from three individual plt1 plt2 plants, are indicated.
