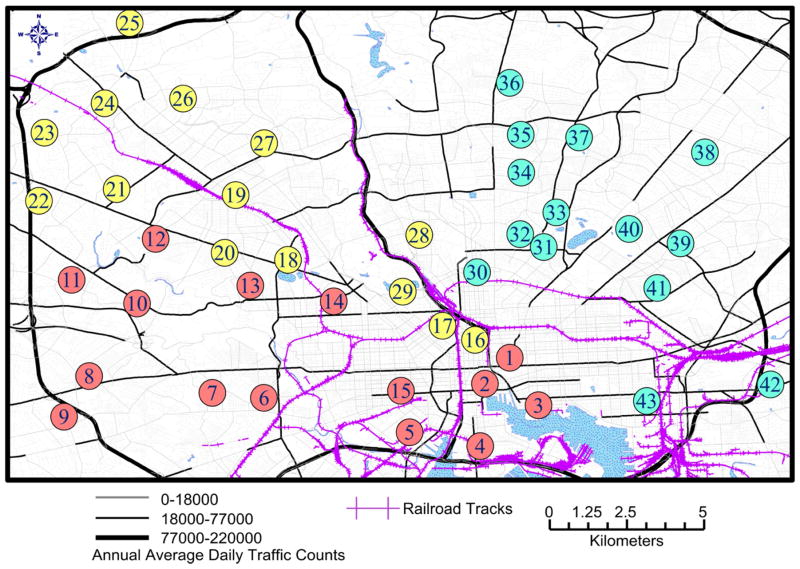
Figure 1.
Map of the study area. Fixed routes were driven for each colored subset of locations, with each route driven every third day. Map produced using ArcMap (ESRI Inc., 2014), railroad data from Open Baltimore, map layers from US census (Geography Division, 2008), and traffic counts from Maryland department of transportation (State Highway Administration, 2012).

