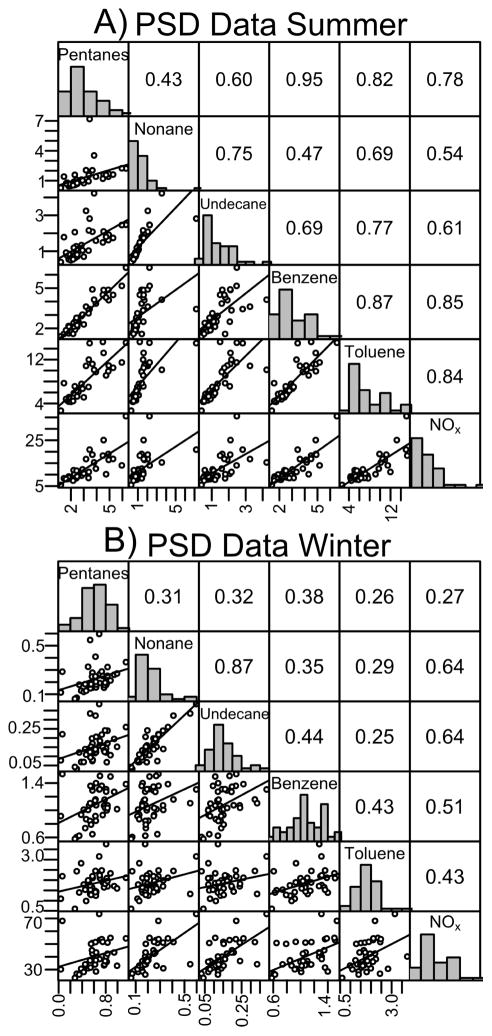
Figure 5.
Correlation scatterplot matrix for select passive sampler detector species for (A) Summer and (B) winter. Pearson’s correlation coefficients are in the upper diagonal, values greater than 0.4 are significant (2-sided p = 0.01). Organic species have units of μg/m3, Pentanes have been divided by a factor of 100, and NOx has units of ppb.

