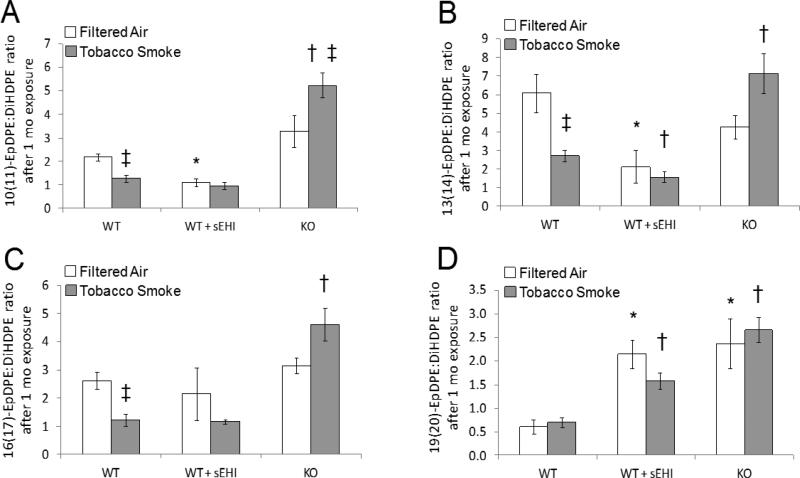
Figure 8. DHA derived plasma epoxide to diol ratio after exposure to filtered air (white bars) or tobacco smoke (grey bars) for one month.
*P < 0.05, treated and K/O filtered air exposed groups significantly different from the filtered air exposed control group. †P < 0.05 treated and K/O tobacco smoke exposed groups significantly different from the tobacco smoke exposed control group. ‡P < 0.05, significant differences between tobacco smoke and filtered air exposure within the WT and K/O mice, respectively.

