
Figure 3.
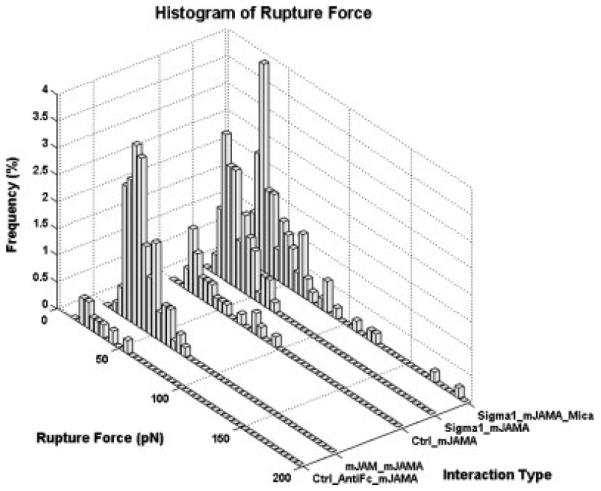
Histograms of bond rupture frequencies for different interaction types at reproach velocity of 5 μ/s. A contact force of 200 pN and a contact time of 1 ms were used for all experiments. Control experiments showed few adhesion events. Each histogram represents data analyzed from over 500 force curves.