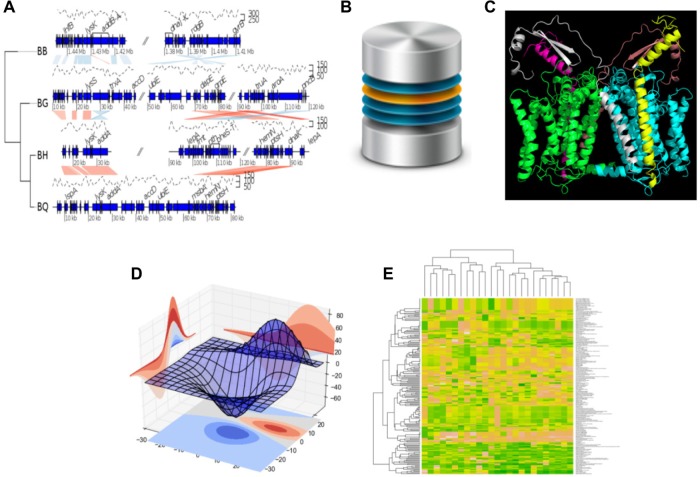
Figure 3.
Five approaches for the tertiary stage on the investigation of disease-driven mutations: (A) Visualization of random data on multisegment plot, 4 Bartonella genomes by the genoPlotR115; (B) Annotate mutation according to an annotation database (http://creativecommons.org/licenses/by-nc-sa/3.0/legalcode); (C) Predict mutation effect through analysis of the protein 3D structure generated by the tool PyMol (www.pymol.org); (C) Analyze the possible mutation effect with a statistical method; and (E) Detect mutation effect via generation of gene signature.
Note: Figure 3B is reused from http://barrymieny.deviantart.com/ under the conditions of the CC BY-NC 3.0 license.

