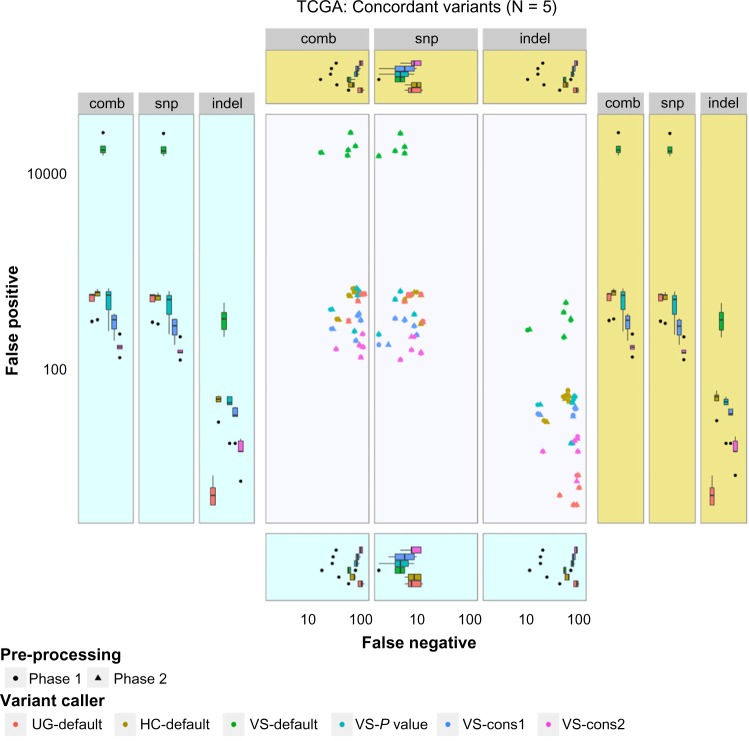
Figure 6.
Discordance among the TCGA-derived and workflow-derived variants.
Notes: X-axis denotes the false-negative values, while Y-axis denotes false-positive values. Both axes were log transformed. The pale blue and yellow boxes indicate phase 1 and phase 2 boxplots of the axes variables, respectively. The results from variant callers were color coded.

