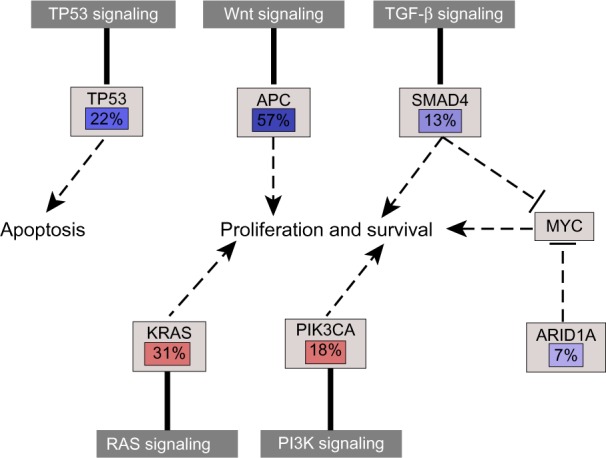
Figure 8.

Frequencies of genetic changes leading to deregulation of pathways, which is associated with pathological phenotypes.
Notes: Red denotes activated genes and blue denotes inactivated genes.

Frequencies of genetic changes leading to deregulation of pathways, which is associated with pathological phenotypes.
Notes: Red denotes activated genes and blue denotes inactivated genes.