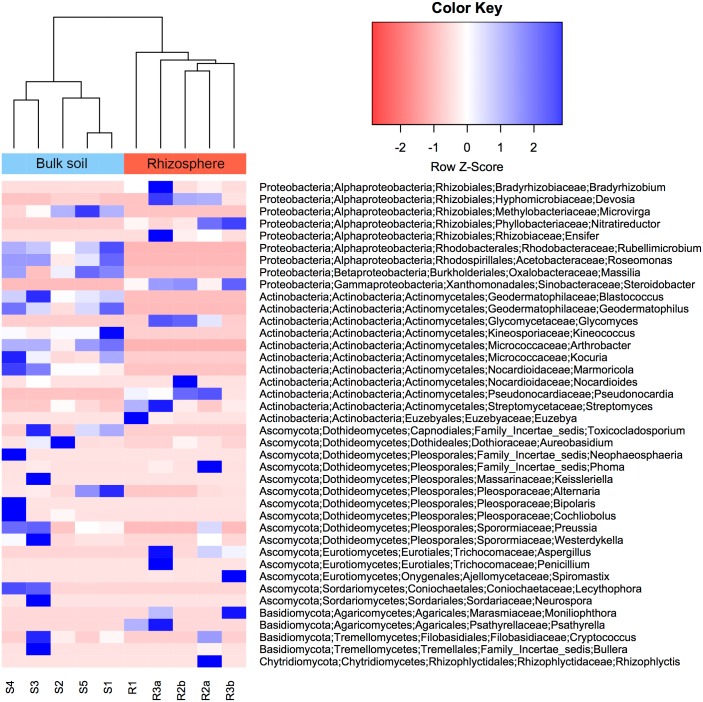
Fig 2. Heatmap displaying the most abundant genera for rhizosphere and bulk soil samples.
Samples are clustered based on the percent relative abundance of the forty dominant genera (twenty bacteria and twenty fungal genera) shown as rows in this figure. Taxonomy for each genus is presented in the order: phylum, class, order, family, genus. Sample nomenclature indicates the sample type (S = bulk soil; R = rhizosphere), replicate (S = 1 to 5, R = 1 to 3) and pseudoreplicate (a, b).

