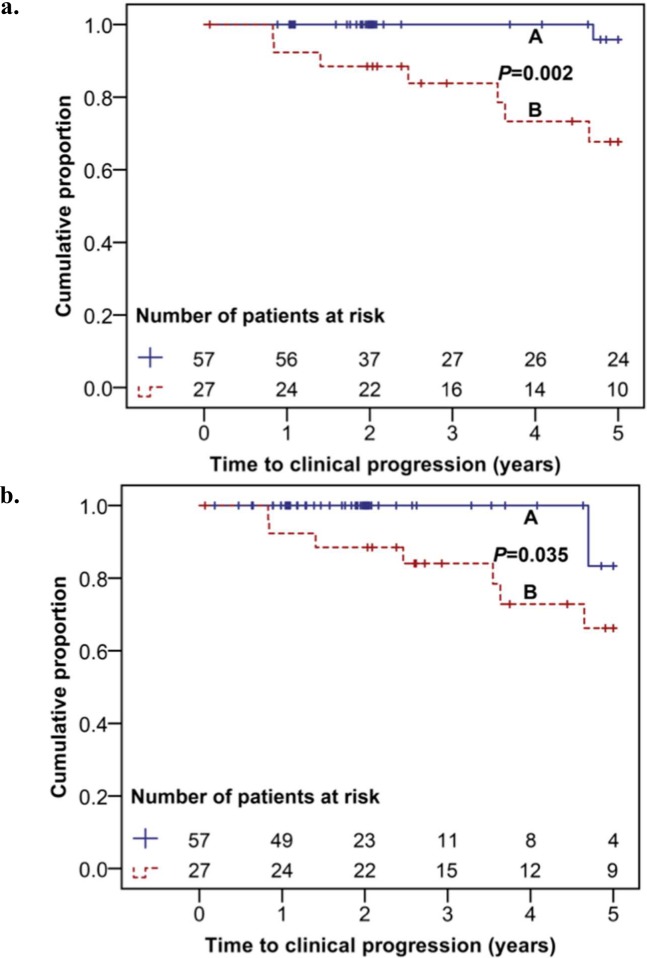
Fig 2. Clinical progression.
(a) Kaplan-Meier curve showing the time to progression to CDC B or C manifestations for group A (treatment initiation within 3 months after diagnosis) and group B (no treatment within 12 months). (b) Kaplan-Meier curve showing the time to progression to CDC B or C manifestations for group A (treatment initiation within 3 months after diagnosis) and B (no treatment within 12 months) censoring patients with a significant treatment interruption.

