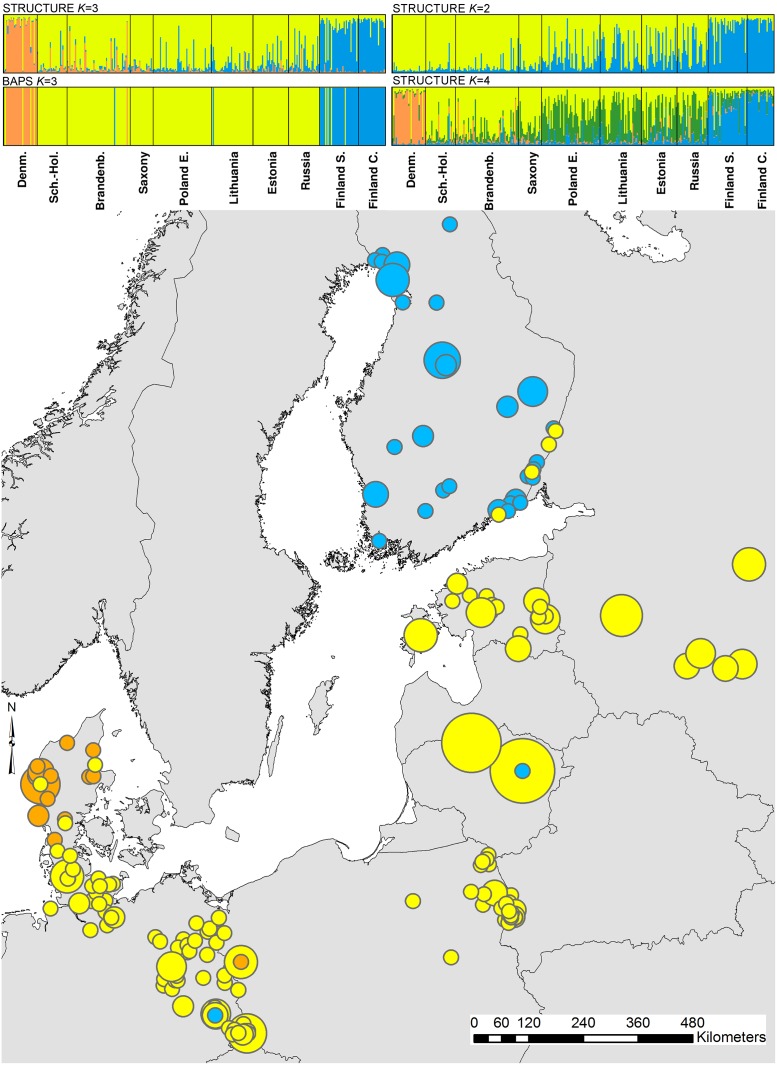
Fig 2. Geographic distribution of the BAPS derived clusters (K = 3), obtained using the spatial model.
Different colours represent the model assignment of individuals to the different clusters. The size of the symbol is representative of the number of individuals sampled at that location (see also Fig 1). Inset: Summary of the assignment results obtained with STRUCTURE (K = 2 to 4) and BAPS (K = 3). Each individual is represented by a single vertical line, representing the individual`s estimated proportion of membership to the genetic cluster. Colours correspond to the clusters in the main figure. The order of the individuals was the same in both assignments. The STRUCTURE K = 4 bar chart represents results from the nine (out of ten) independent runs that converged on the same clustering solution.

