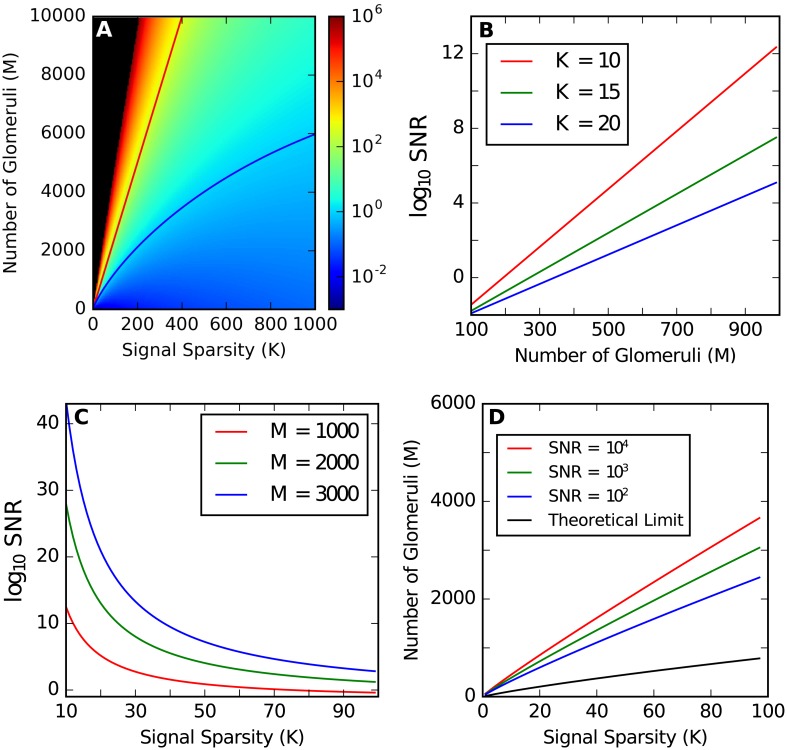
Fig 2. Signal-To-Noise-Ratio (SNR) of the recovered signal in our model.
N = 10000 is used. (A) SNR as a function of K and M. Black is shown for SNR > 106. The blue line shows SNR = 1, and the red line shows SNR = K, i.e. one error occurs on average. (B) Optimal SNR as a function of M. (C) Optimal SNR as a function of K. (D) Number of glomeruli required to reach threshold SNR when optimal connectivity rate is used.

