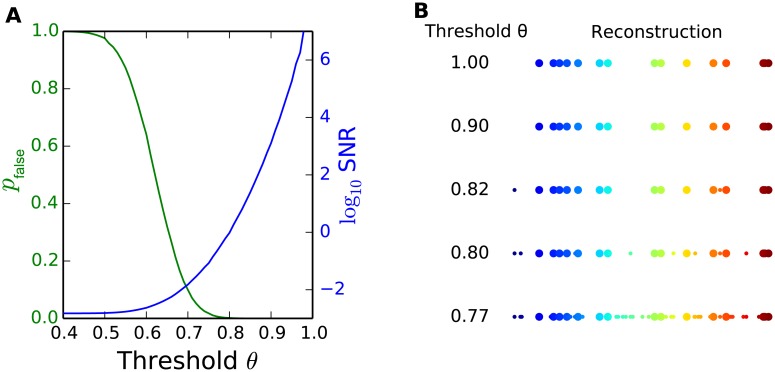
Fig 3. Demonstration of the accuracy-robustness trade-off.
N = 10000, K = 15, M = 1000 and the optimal connectivity rate are used. (A) pfalse and SNR for different activation thresholds at the reconstruction stage. With lower recovery thresholds, the robustness of the system to recovery noise increases, while the false detection rate increases, and the SNR of recovered signal decreases. (B) An example of the recovered signal with different recovery thresholds. True signal is shown in big colored dots, while the reconstruction error is represented by small colored dots. As we lower the threshold, the recovered signal becomes noisier.

