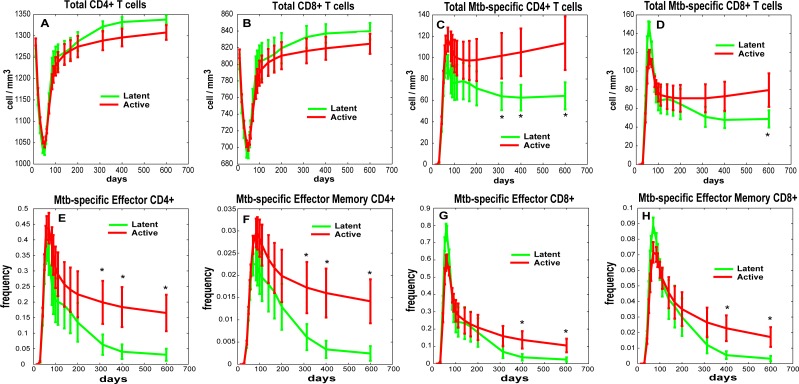
Fig 7. Scaling to host infection outcome predictions for Mtb-specific T cell frequencies.
We built/calibrated virtual NHPs that replicate granuloma heterogeneity and variability in the lung of 43 NHPs (up to 600 days post infection, see S1 Table). Here, in silico blood trajectories of total T cell levels and Mtb-specific T cell frequencies grouped by clinical outcome (as shown in S1 Table) are plotted over 600 days for the same set of virtual NHPs. The in silico data shown here have been generated following steps illustrated in Fig 6, as well as in Materials and Methods section. The two virtual trajectories representing the 43 virtual NHPs are displayed in all the panels as mean +/- 2x(standard error). The asterisks show significant (p<0.05) student t-test between the two trajectories at the same time point. These in silico trajectories have been generated with zero initial conditions for the Mtb-specific T cell memory phenotypes (except for Naïve Mtb-specific T cells, see Materials and Methods section for details). No experimental data is shown here since blood measures are only available for a limited number of NHPs (I.e., 12 out o 43) and only up to 180 days post infection. Panel A: Total CD4+ T cell levels. Panel B: Total CD8+ T cell levels. Panel C: Total Mtb-specific CD4+ T cell levels. Panel D: Total Mtb-specific CD8+ T cell levels. Panels E: Mtb-specific frequencies of Effector CD4+ T cells. Panels F: Mtb-specific frequencies of Effector Memory CD4+ T cells. Panels G: Mtb-specific frequencies of Effector CD8+ T cells. Panels H: Mtb-specific frequencies of Effector Memory CD8+ T cells.

