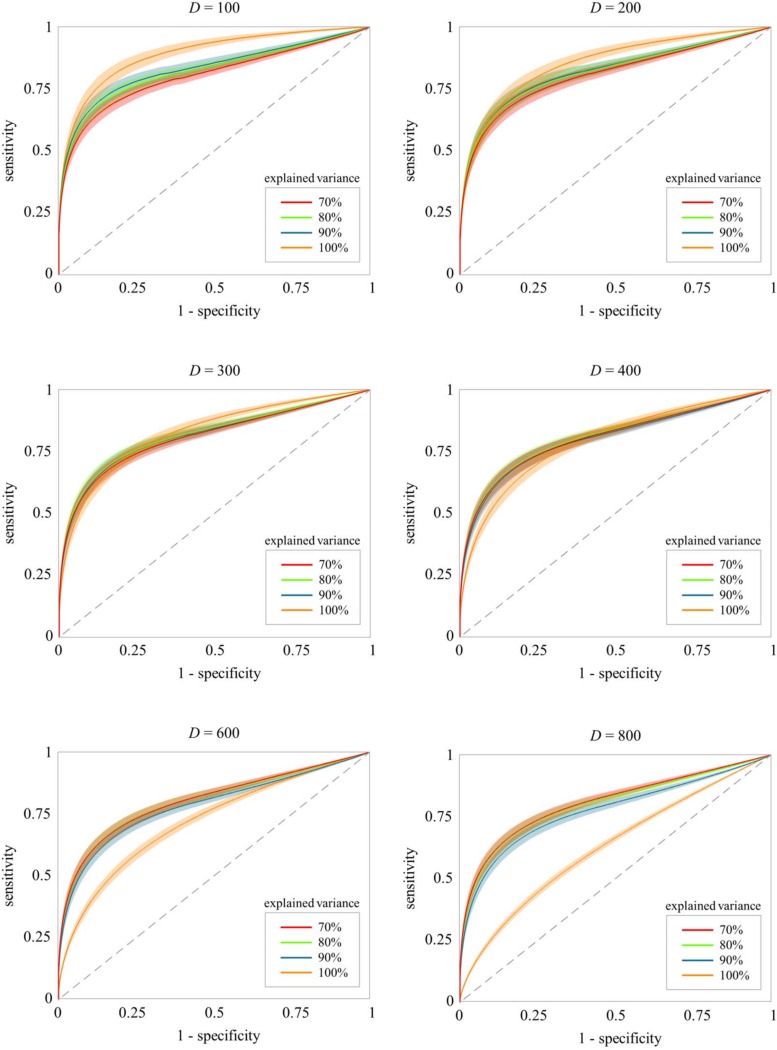
Fig 3. The lsGCI results for synthetic data: mean ROC curves (100 realizations) with standard deviation bands for D = 100,200,300,400,600,800, N = 1000, and various variance explanations.
A variance explanation of 100% corresponds to the classical GCI, whereas all other shown variance explanations correspond to the lsGCI.

