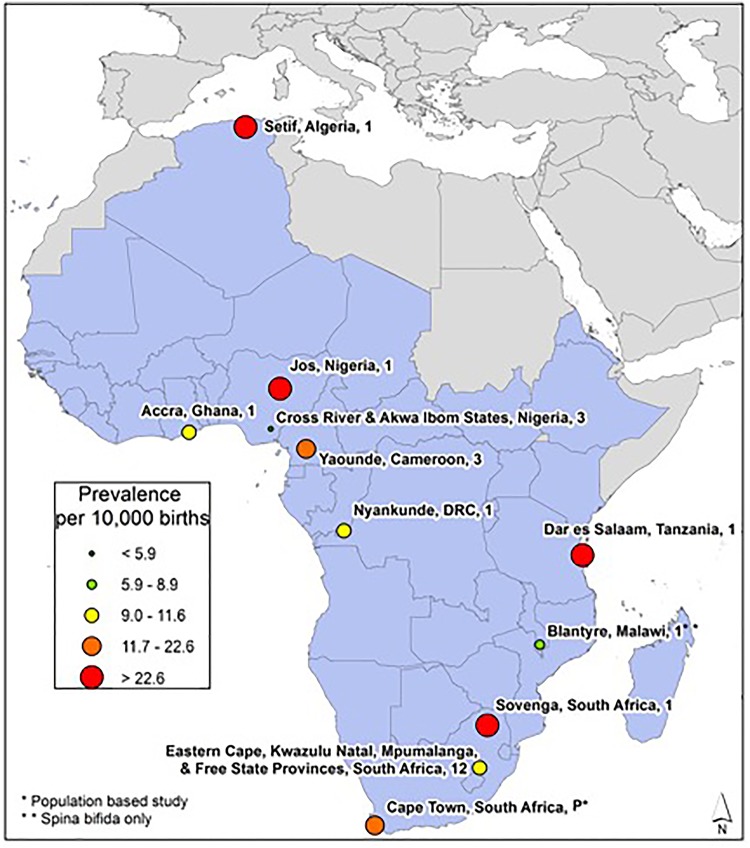
Fig 5. African Region Neural Tube Defects Prevalence Estimates (Location, Number of Hospitals).
If there were national data available for more than one NTD, the entire country was filled-in based on the prevalence per 10,000 births. In instances where multiple prevalence estimates were available at the national level, the prevalence reported by the study/report with the least risk-of-bias was selected. Countries colored in grey are not a part of the World Health Organization region. Shapefile reprinted from http://www.diva-gis.org under a CC BY license, with permission from DIVA-GIS and Dr. Robert Hijmans.

