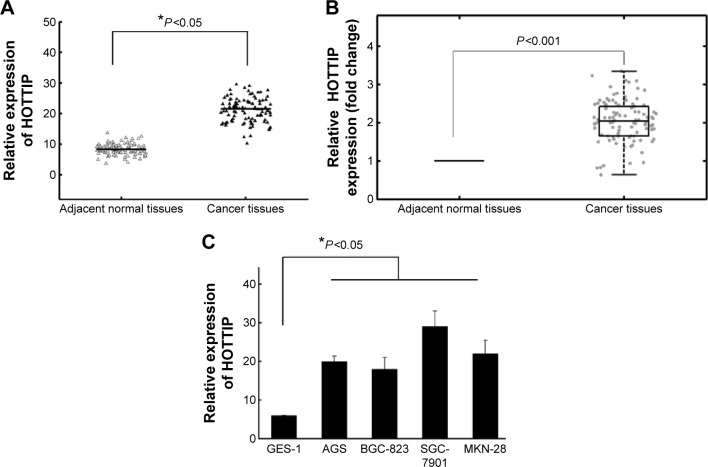
Figure 1.
Relative HOTTIP expression levels in gastric cancer tissues and cell lines.
Notes: (A) HOTTIP expression was significantly higher in gastric cancer tissues than in the corresponding NATs. HOTTIP levels were calculated by the 2−ΔCt method and normalized to GAPDH. (B) The fold change of HOTTIP in GC relative to the matched NAT in 98 GC patients. (C) Increased HOTTIP expression in four GC cell lines compared to normal gastric epithelial cell line GES-1. *P<0.05.
Abbreviations: GC, gastric cancer; HOTTIP, HOXA transcript at the distal tip; NAT, normal adjacent tissue.

