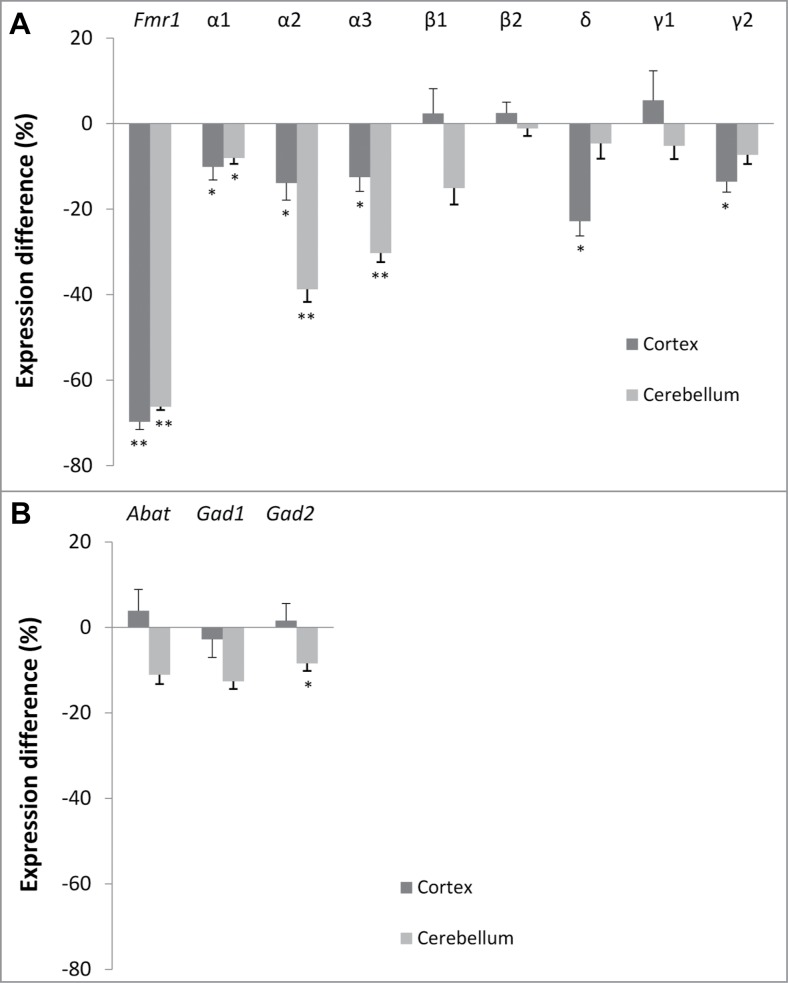
Figure 1.
Brain region-specific differences in GABAA receptor subunit and enzyme expression. Difference in normalized expression between Fmr1 KO and WT mice in cortex (n = 8 and n = 8, respectively) and cerebellum (n = 9 and n = 7, respectively) at postnatal day 22. (A) GABAA receptor subunit expression. (B) Enzymes in GABA metabolism. Error bars represent SEM. A Mann-Whitney U test was used to determine the significant differences between both genotypes (*** p < 0.001; **P < 0.01, *P < 0.05).

