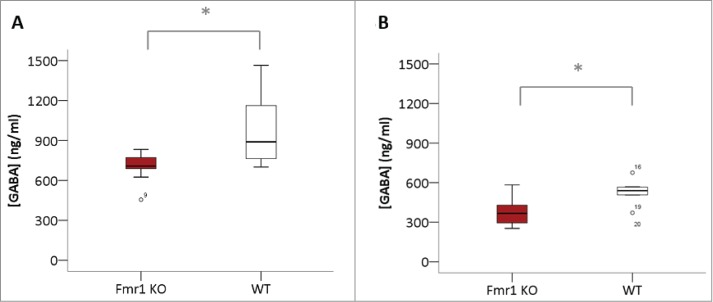
Figure 2.

Reduced GABA concentrations in Fmr1 KO homogenates. GABA concentrations (ng/ml) in homogenates of cerebellum (A) and hippocampus (B) of Fmr1 KO (n=10, gray bars) and WT (n=10, white bars) mice, collected at postnatal day 22. Significant differences were identified with the Mann-Whitney U test (*p < 0.05).
