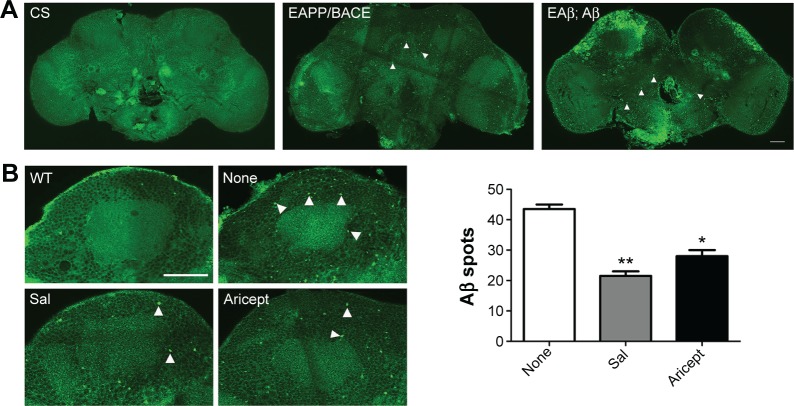
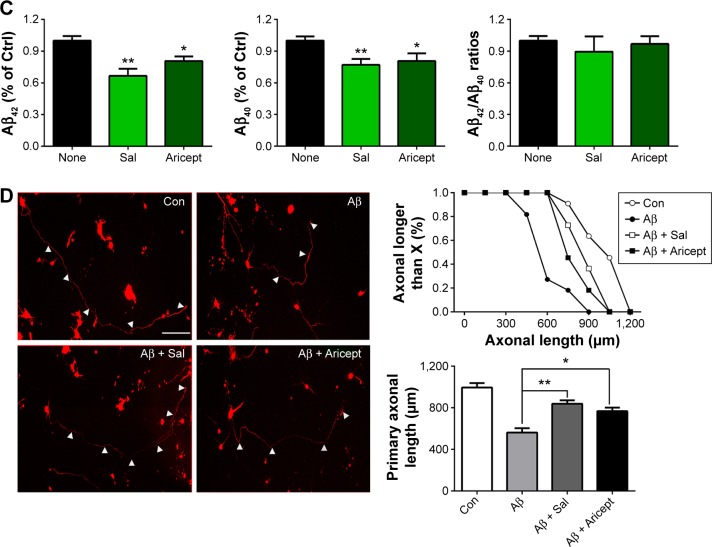
Figure 3.
Effect of Sal on Aβ accumulation in vivo and Aβ induced neurotoxicity in vitro.
Notes: (A) Micrographs of Aβ peptide expression in intact transgenic fly brains. CS, EAPP/BACE and EAβ; Aβ flies showed spot-like staining for Aβ-antibody 6E10 staining. Scale bar in insets represent 50 µm. Arrowheads indicate 6E10-antibody positivity. (B) Immunofluorescence staining shows the level of Aβ deposition in EAPP/BACE flies after Sal or Aricept treatment for 30 days. Arrowheads indicate 6E10-antibody positivity. Scale bar, 50 μm. The number of amyloid plaques was quantified. *P<0.05, **P<0.01. (C) Aβ40 and Aβ42 levels were measured by ELISA at day 30. The values are mean ± SEM. Each value represents the mean of three experiments. *P<0.05 and **P<0.01 versus the control group. (D) Primary cultured neurons were transfected with tdTomato and APP plasmids and treated with Sal for 24 hours. The axonal lengths (arrowheads) were measured and quantified. Scale bar, 100 μm. *P<0.05 and **P<0.01 by one-way ANOVA followed by Tukey’s test.
Abbreviations: APP, amyloid precursor protein; BACE, beta-secretase; ELISA, enzyme-linked immunosorbent assay; h, hours; ANOVA, analysis of variance; CS, Canton-S; WT, wild type; Sal, salidroside; Ctrl, control; Aβ, amyloid-β; SEM, standard error of the mean; Con, normal control.


