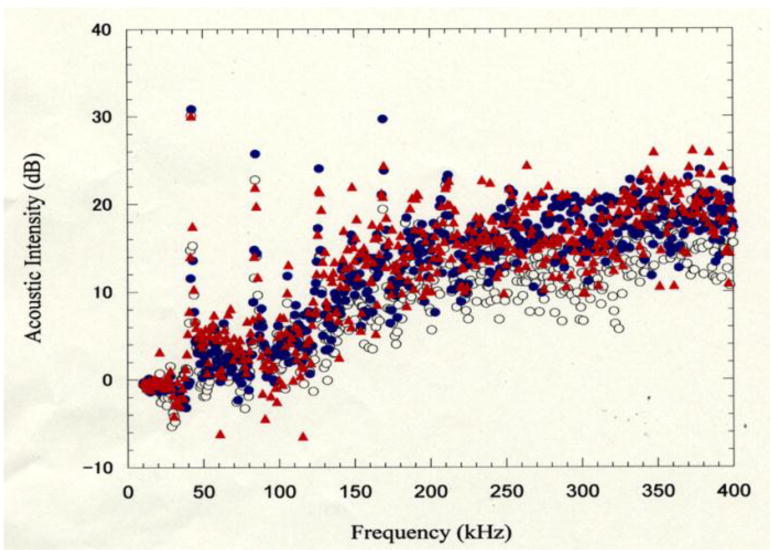
Figure 3.

Cavitation effects in the different frequencies (kHz). The base lines of the cavitation at (US only), (US + TiO2) and at (US + TiO2+ALA) groups were normalized at the average (AVR) intensities of 5 times experiments, respectively. Spectrum Analyzer (Tektronix 3026 type, Tektronix Japan Ltd. Co., Tokyo, Japan), Probe (Hydrophone) of the cavitation (TC4038 type, RESOV Ltd. Co., Slangerup, Denmark), Source of ultrasonic irradiation (1510J-MT type, Branson Ultrasonics Ltd. Co., Connecticut, USA), The 1 ml sample aqueous solution was irradiated in the degassed water bath. The hydrophone probe was set in the sample tube and the cavitation signal (acoustic noise) was detected by the spectro-analyzer.
