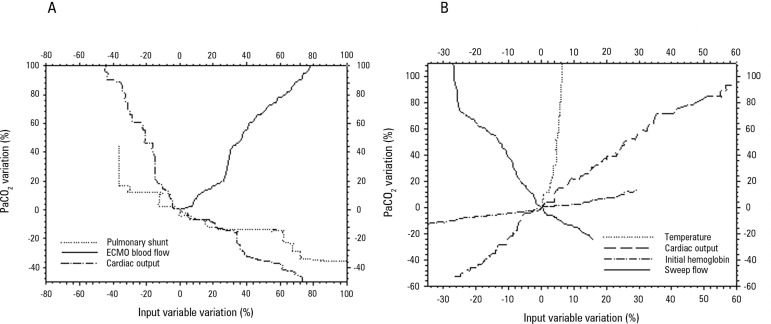
Figure 3.
Spider plots based on the data collected from the animals illustrating the PaO2 (Panel A) and PaCO2 percent (Panel B) variations associated with the variations in the main related variables. The respective main related variables were extracted from the multivariate analysis.
PaO2 - partial pressure of oxygen; PaCO2 - partial pressure of carbon dioxide.

