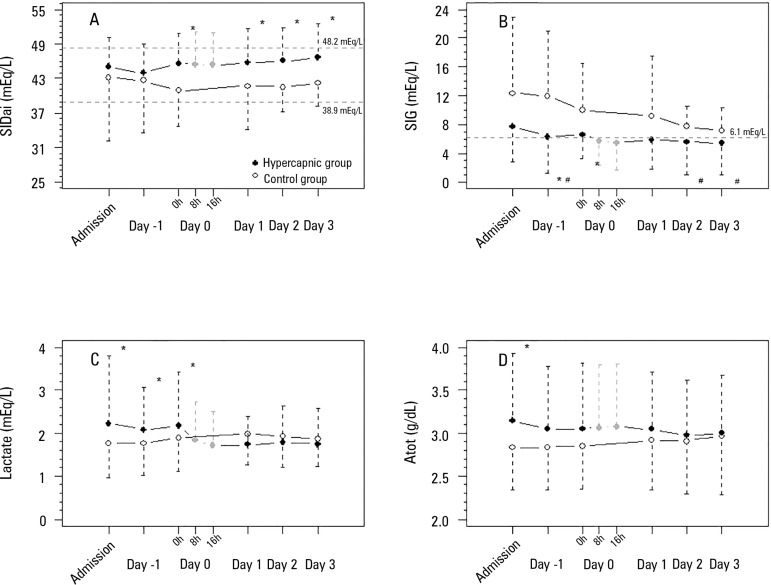
Figure 3.
Physicochemical variables of the acid-base metabolic component before and after hypercapnia initiation. A) SIDai evolution (mixed model fixed effects p = 0.646 for within-group factor analysis, p = 0.045 for between-group factor analysis, and p = 0.224 for group × time interaction analysis). B) Strong ion gap evolution (mixed model fixed effects p < 0.001 for within-group factor analysis, p < 0.001 for between-group factor analysis, and p = 0.007 for group × time interaction analysis). C) Lactate evolution (mixed model fixed effects p < 0.978 for within-group factor analysis, p < 0.001 for between-group factor analysis, and p = 0.975 for group × time interaction analysis). D) Atot evolution (mixed model fixed effects p = 0.141 for within-group factor analysis, p = 0.010 for between-group factor analysis, and p = 0.266 for group × time interaction analysis).
SIDai - inorganic apparent strong ion difference; SIG - strong ion gap; Atot - weak acids in plasma. * Mann-Whitney's post-hoc analysis p < 0.05 versus control group. # Wilcoxon's post-hoc analysis p < 0.05 versus admission day.

