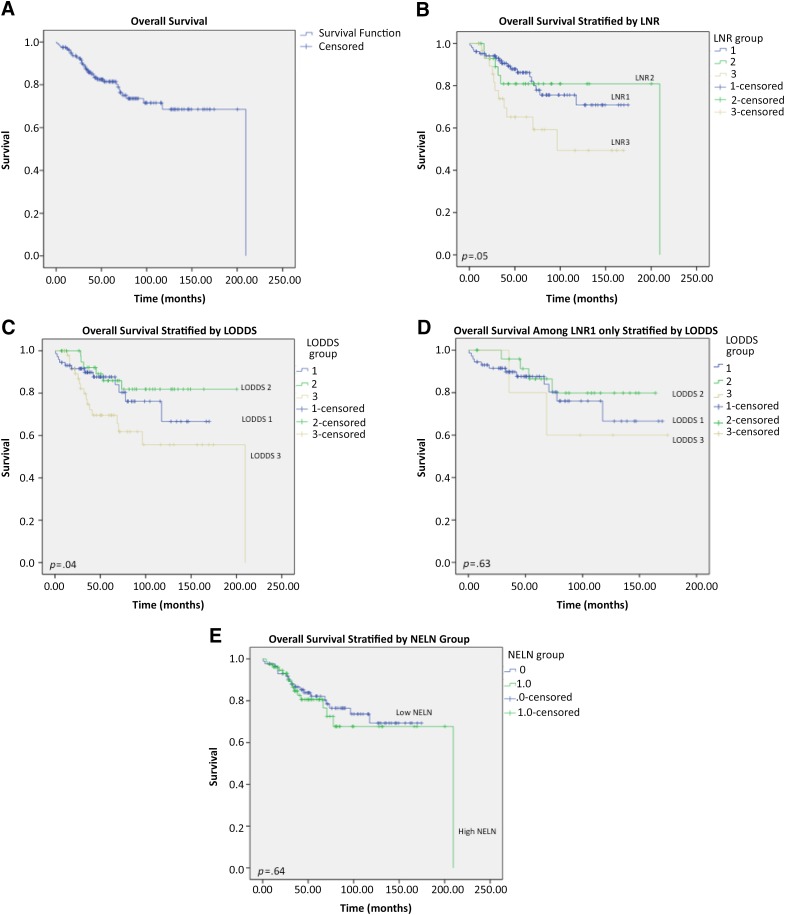
Figure 2.
Overall 5-year survival of study patients. (A): All patients (n = 164). (B): All patients stratified by LNR. (C): All patients stratified by LODDS. (D): All patients in LNR1 stratified by LODDS. (E): Patients stratified into high and low NELN.
Abbreviations: LNR, lymph node ratio; LNR1, lymph node ratio of 0; LNR2, lymph node ratio of 0.01–0.176; LRN3, lymph node ratio >0.176; LODDS, log odds of positive lymph nodes; NELN; number of examined lymph nodes.

