
Fig. 1.
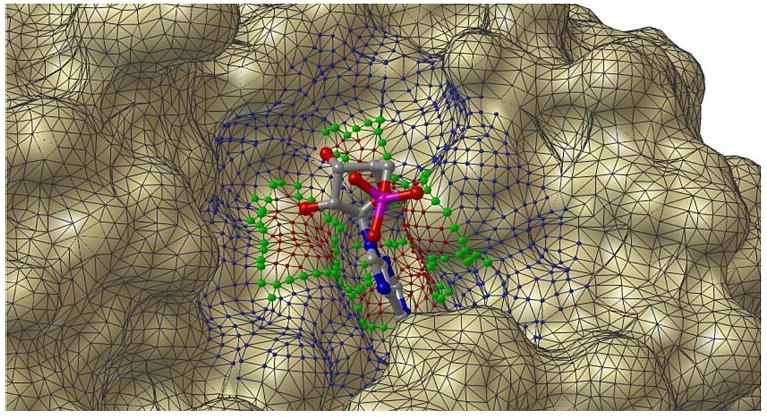
Surface expansion method. The initial surface patch that contact the AMP ligand is shown with red spheres on the vertices and green spheres vertices defining the boundary of the patch. The patch is expanded along the surface. The blue spheres show vertices of the surface that are within 5.0 Å of the green vertices. The distance is measured on the surface as the sum of the edge length for the shortest path between a green and a blue vertex. All the atoms that contribute to the surface patch and the expansion are included in the grown active site. This figure is prepared by PMV [15], surface calculated from MSMS [16]