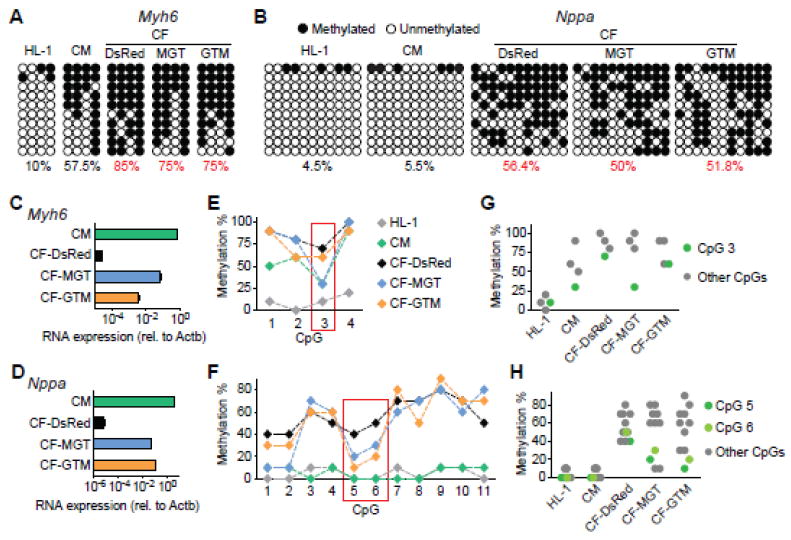
Figure 5. Demethylation of cardiac gene promoters during iCM reprogramming.

Bisulfite sequencing of iCMs generated under the optimal condition (MGT) and the least optimal one (GTM) were performed on day 3. DNA methylation states at Myh6 (A, E, G) and Nppa (B, F, H) promoters were determined. RNA expression levels of Myh6 (C) and Nppa (D) were also determined by qRT-PCR. (A, B) Methylation states of all 4 (Myh6) or 11 (Nppa) CpGs in the promoters from ten representative clones. Numbers indicate total methylation % combining all clones and all CpGs. (E, F) Methylation % of individual CpGs. (G, H) Methylation % of main contributing CpGs. HL-1 and primary CM: CM controls. DsRed: retroviral transduction control.
