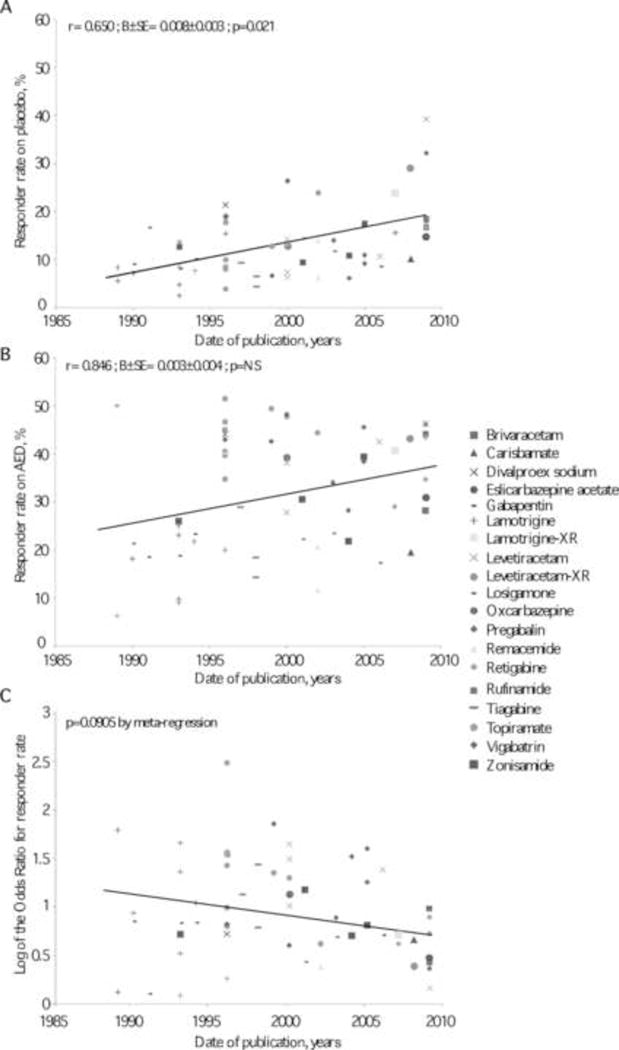
FIGURE 1.

Relationships between responder rates (A, placebo-treated groups; B, active medication-treated groups) and year of trial publication. Both correlations were tested by linear regression adjusted for AEDs. The relationship between the size of the treatment effect and year of publication is shown in panel C and was analyzed by meta-regression. r, correlation coefficient; B, regression coefficient; SE, standard error. (Reproduced with permission (Rheims et al., 2011)).
