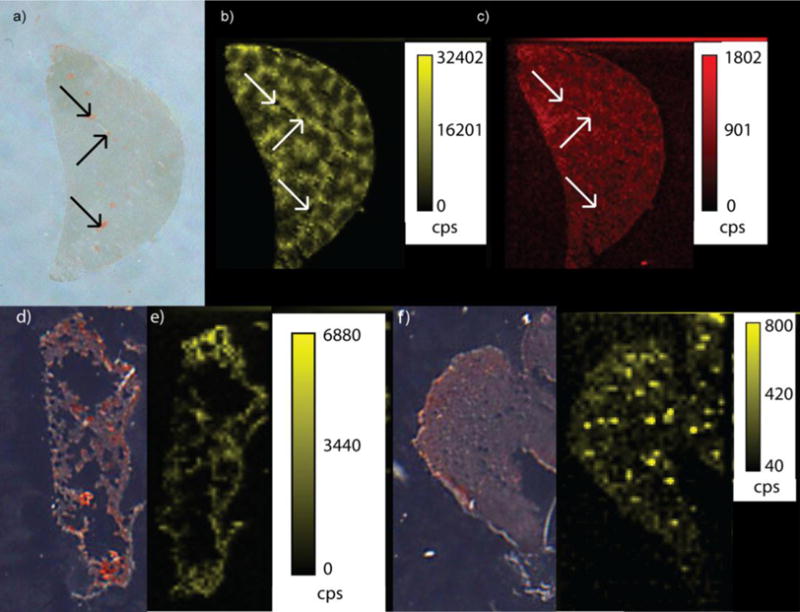
Figure 4.

a) Optical image of a liver tissue taken from a mouse injected with AuNP 1. The red spots in the optical image represent the blood vessels that traverse through the liver (black arrows indicate the portal veins present. b) LA-ICP-MS image of the same liver showing the distribution of gold. c) LA-ICP-MS image of the liver showing the distribution of Fe. d) Optical image of a lung tissue taken from a mouse injected with AuNP 1. e) LA-ICP-MS image of the same lung tissue showing the distribution of gold. f) Optical image of a kidney tissue taken from a mouse injected with AuNP 1. g) LA-ICP-MS image of the same kidney tissue showing the distribution of gold. (cps = counts per second)
