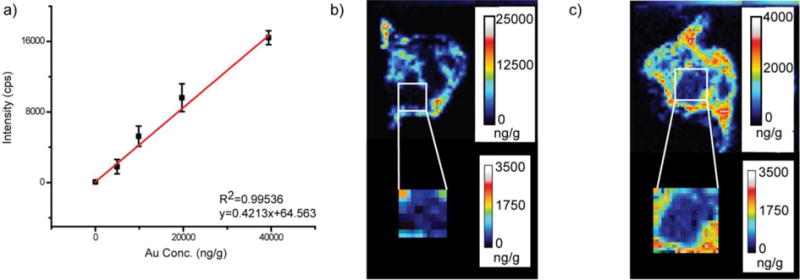
Figure 5.

a) Example calibration curve obtained for AuNP 3 using chicken breast homogenate as the matrix. b) Quantitative LA-ICP-MS image of a spleen taken from a mouse injected with AuNP 3. c) Quantitative LA-ICP-MS image of a spleen taken from a mouse injected with AuNP 2.
