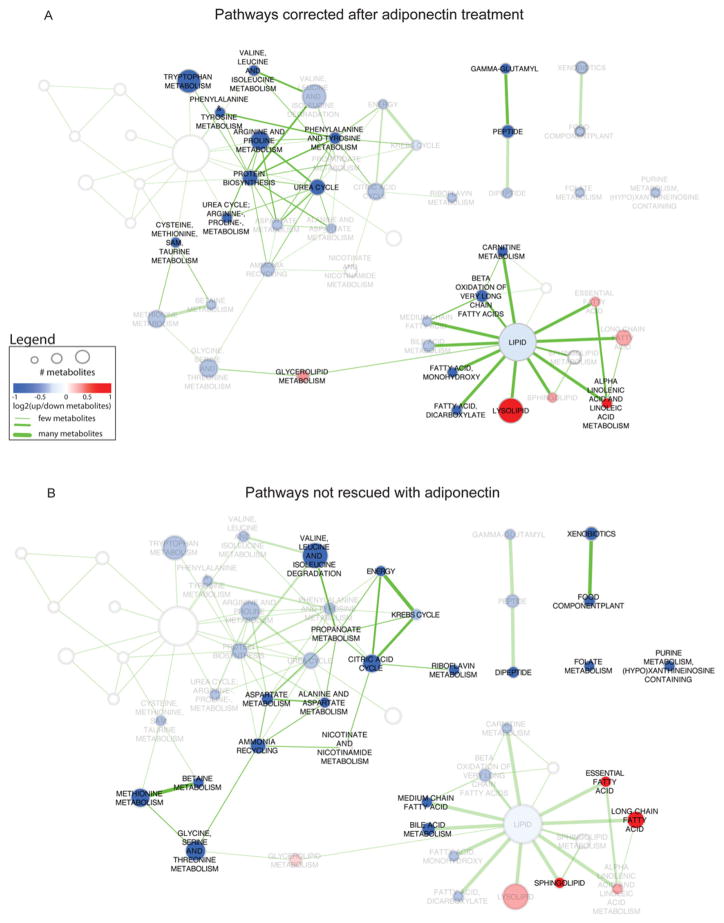
Figure 3. Bioinformatic analysis of pathways altered by adiponectin or not.
HFD compared with chow enriched pathway network highlighting pathways rescued (A) and not rescued (B) by adiponectin. Enriched pathways in HFD compared with chow are annotated with node labels and colours indicating the direction of metabolite expression, where red is up-regulated, blue is down-regulated and white indicates there was no change. The transparency of the nodes was increased in (A) if it was a pathway not seen in the HFD + adiponectin compared with HFD enriched pathway set to highlight pathways (common to both HFD compared with chow and HFD±adiponectin compared with HFD) that were rescued by adiponectin. The transparency of the nodes was increased in (B) if it was a pathway found in HFD + adiponectin compared with HFD enriched pathway set to highlight pathways unique to HFD compared with chow and not rescued by adiponectin.

