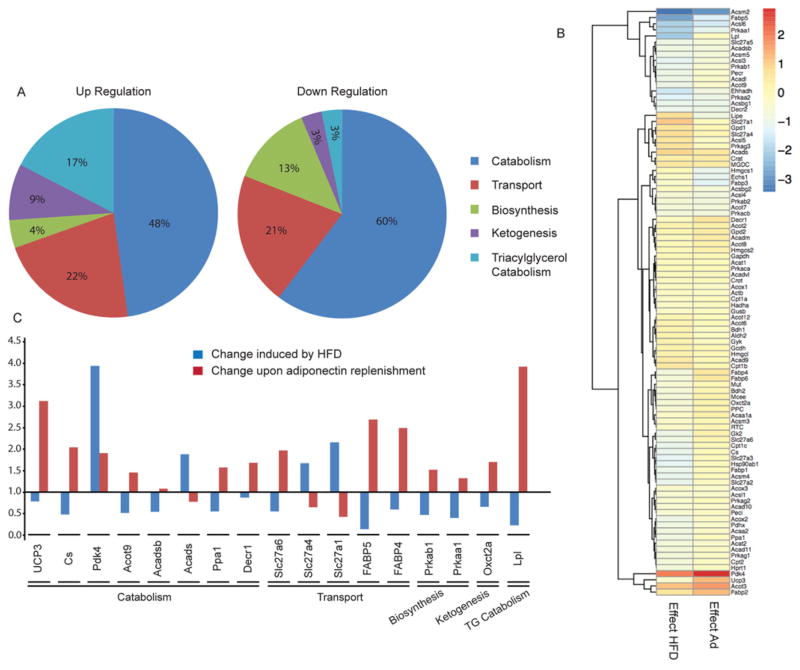
Figure 4. qPCR array analysis of genes involved in fatty acid metabolism.
AdKO mice fed either regular chow or on a 60 % HFD for 6 weeks. HFD mice received an additional 2 weeks’ adiponectin or saline treatment at the dosage of 3 μg/g of body weight via intraperitoneal injection. Liver tissues were then collected 5 min after 4 units/kg insulin stimulation for later analysis. (A) Effect of the HFD on genes involved in fatty acid metabolism. (B) Heat map revealed the effect of the HFD (left-hand column) and adiponectin (right-hand column) on genes involved in fatty acid metabolism. (C) List of genes involved in fatty acid metabolism that were significantly altered by the HFD and significantly corrected by adiponectin treatment. Results are fold changes. n ≥ 3.

